29
/
en
AIzaSyAYiBZKx7MnpbEhh9jyipgxe19OcubqV5w
April 1, 2024
234421
Saudi Arabia
SAU
true
2
1
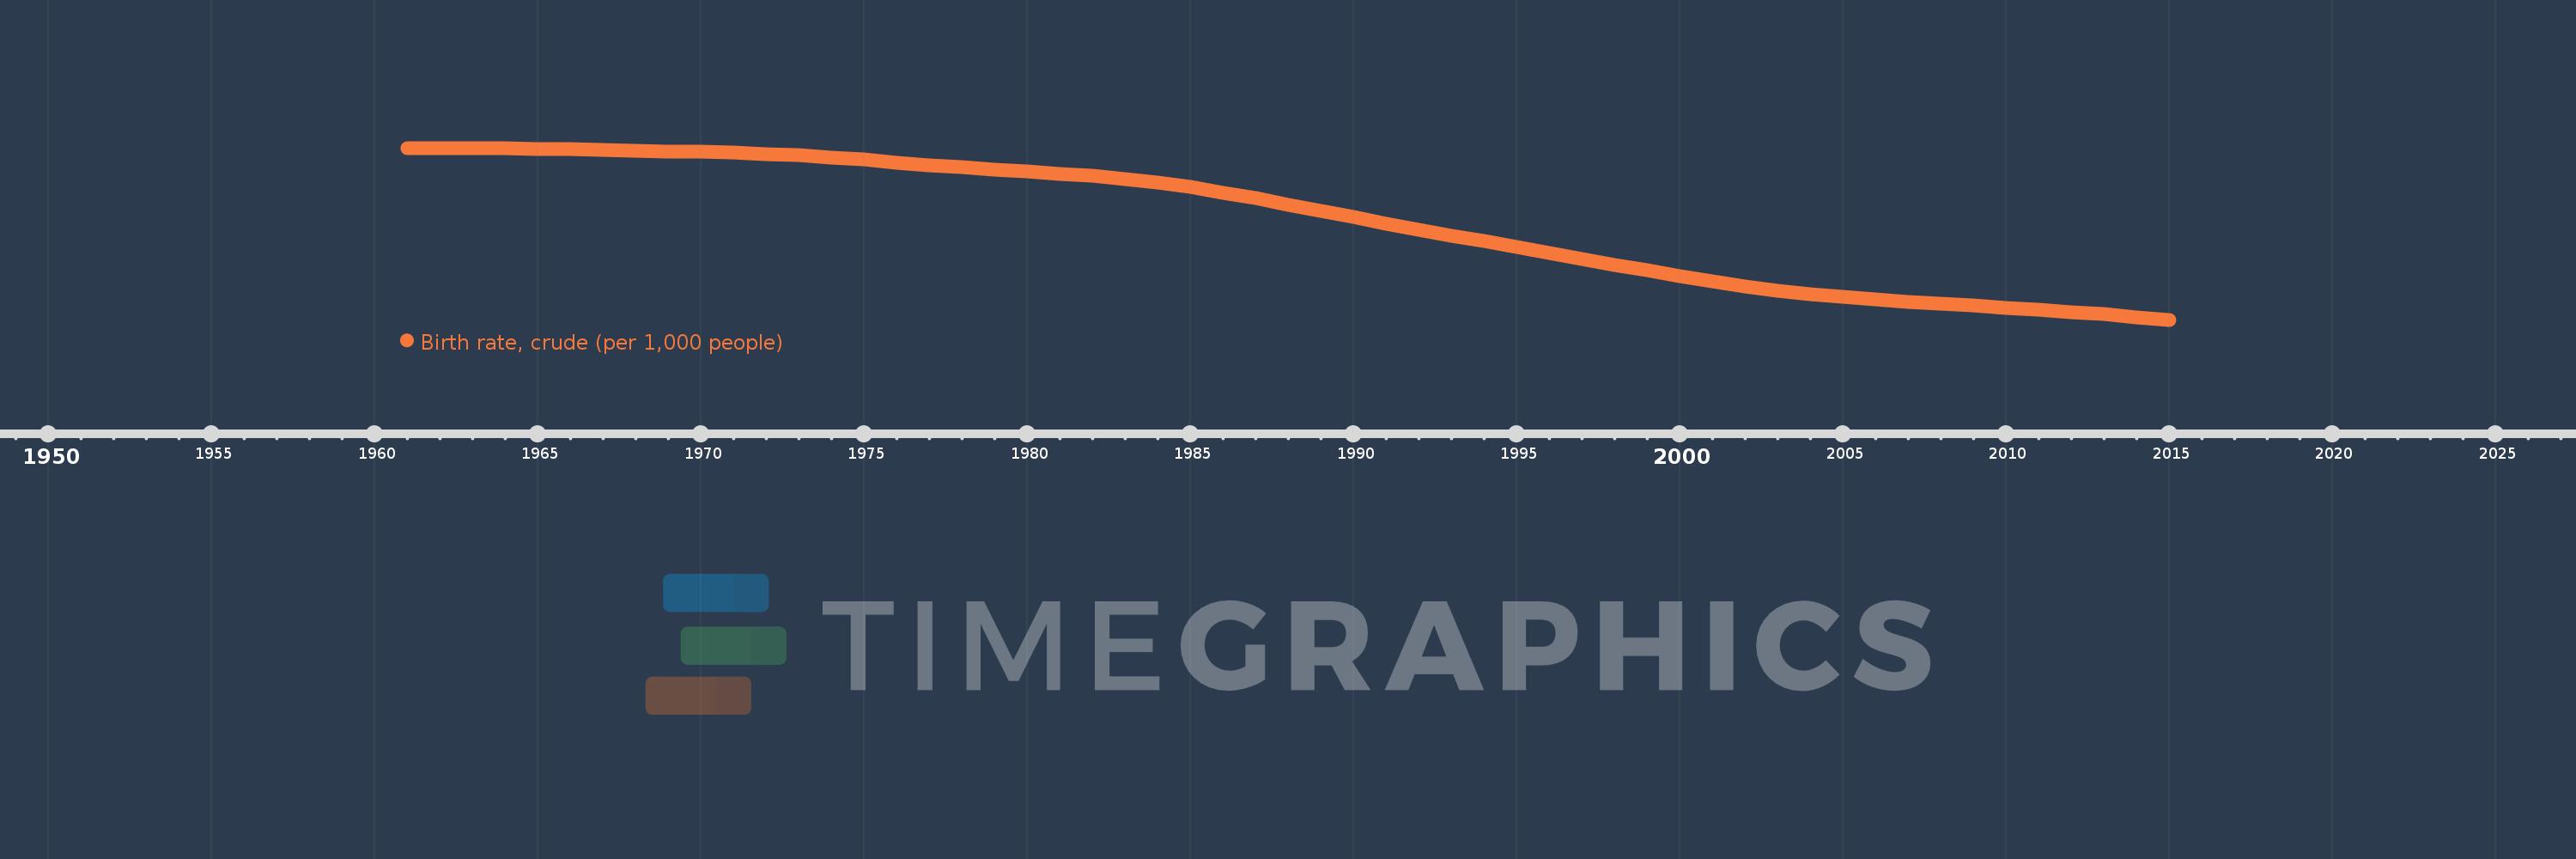
Birth rate, crude (per 1,000 people)
2015,2014,2013,2012,2011,2010,2009,2008,2007,2006,2005,2004,2003,2002,2001,2000,1999,1998,1997,1996,1995,1994,1993,1992,1991,1990,1989,1988,1987,1986,1985,1984,1983,1982,1981,1980,1979,1978,1977,1976,1975,1974,1973,1972,1971,1970,1969,1968,1967,1966,1965,1964,1963,1962,1961
This statistics in other country:
AfghanistanAlbaniaAlgeriaAmerican SamoaAndorraAngolaAntigua and BarbudaArab WorldArgentinaArmeniaArubaAustraliaAustriaAzerbaijanBahamas, TheBahrainBangladeshBarbadosBelarusBelgiumBelizeBeninBermudaBhutanBoliviaBosnia and HerzegovinaBotswanaBrazilBrunei DarussalamBulgariaBurkina FasoBurundiCabo VerdeCambodiaCameroonCanadaCaribbean small statesCayman IslandsCentral African RepublicCentral Europe and the BalticsChadChannel IslandsChileChinaColombiaComorosCongo, Dem. Rep.Congo, Rep.Costa RicaCote d'IvoireCroatiaCubaCuracaoCyprusCzech RepublicDenmarkDjiboutiDominicaDominican RepublicEarly-demographic dividendEast Asia & PacificEast Asia & Pacific (excluding high income)East Asia & Pacific (IDA & IBRD countries)EcuadorEgypt, Arab Rep.El SalvadorEquatorial GuineaEritreaEstoniaEthiopiaEuro areaEurope & Central AsiaEurope & Central Asia (excluding high income)Europe & Central Asia (IDA & IBRD countries)European UnionFaroe IslandsFijiFinlandFragile and conflict affected situationsFranceFrench PolynesiaGabonGambia, TheGeorgiaGermanyGhanaGreeceGreenlandGrenadaGuamGuatemalaGuineaGuinea-BissauGuyanaHaitiHeavily indebted poor countries (HIPC)High incomeHondurasHong Kong SAR, ChinaHungaryIBRD onlyIcelandIDA & IBRD totalIDA blendIDA onlyIDA totalIndiaIndonesiaIran, Islamic Rep.IraqIrelandIsle of ManIsraelItalyJamaicaJapanJordanKazakhstanKenyaKiribatiKorea, Dem. People’s Rep.Korea, Rep.KosovoKuwaitKyrgyz RepublicLao PDRLate-demographic dividendLatin America & Caribbean Latin America & Caribbean (excluding high income)Latin America & the Caribbean (IDA & IBRD countries)LatviaLeast developed countries: UN classificationLebanonLesothoLiberiaLibyaLiechtensteinLithuaniaLow & middle incomeLow incomeLower middle incomeLuxembourgMacao SAR, ChinaMacedonia, FYRMadagascarMalawiMalaysiaMaldivesMaliMaltaMarshall IslandsMauritaniaMauritiusMexicoMicronesia, Fed. Sts.Middle East & North AfricaMiddle East & North Africa (excluding high income)Middle East & North Africa (IDA & IBRD countries)Middle incomeMoldovaMonacoMongoliaMontenegroMoroccoMozambiqueMyanmarNamibiaNepalNetherlandsNew CaledoniaNew ZealandNicaraguaNigerNigeriaNorth AmericaNorwayOECD membersOmanOther small statesPacific island small statesPakistanPalauPanamaPapua New GuineaParaguayPeruPhilippinesPolandPortugalPost-demographic dividendPre-demographic dividendPuerto RicoQatarRomaniaRussian FederationRwandaSamoaSan MarinoSao Tome and PrincipeSaudi ArabiaSenegalSerbiaSeychellesSierra LeoneSingaporeSint Maarten (Dutch part)Slovak RepublicSloveniaSmall statesSolomon IslandsSomaliaSouth AfricaSouth AsiaSouth Asia (IDA & IBRD)South SudanSpainSri LankaSt. Kitts and NevisSt. LuciaSt. Martin (French part)St. Vincent and the GrenadinesSub-Saharan Africa Sub-Saharan Africa (excluding high income)Sub-Saharan Africa (IDA & IBRD countries)SudanSurinameSwazilandSwedenSwitzerlandSyrian Arab RepublicTajikistanTanzaniaThailandTimor-LesteTogoTongaTrinidad and TobagoTunisiaTurkeyTurkmenistanUgandaUkraineUnited Arab EmiratesUnited KingdomUnited StatesUpper middle incomeUruguayUzbekistanVanuatuVenezuela, RBVietnamVirgin Islands (U.S.)West Bank and GazaWorldYemen, Rep.ZambiaZimbabwe Timeline:
This timeline shows a graph from 1961 to 2015 of Saudi Arabia. No data until 1960. Number of actual observations by date: 55.
Source name:
World Development Indicators
Source organization:
(1) United Nations Population Division. World Population Prospects, (2) Census reports and other statistical publications from national statistical offices, (3) Eurostat: Demographic Statistics, (4) United Nations Statistical Division. Population and Vital Statistics Reprot (various years), (5) U.S. Census Bureau: International Database, and (6) Secretariat of the Pacific Community: Statistics and Demography Programme.
Categories, topics:
Health
Last updated:
apr 23, 2017
Indicators value changes by year
Minimum:
20.139
jan 1, 2015
Maximum:
47.577
jan 1, 1961
At the date of observation
Value
Absolute change
Change from previous value
jan 1, 1961
47.577
+47.577
0.0%
jan 1, 1962
47.576
-0.001
0.0%
jan 1, 1963
47.556
-0.02
-0.04%
jan 1, 1964
47.511
-0.045
-0.09%
jan 1, 1965
47.439
-0.072
-0.15%
jan 1, 1966
47.345
-0.094
-0.2%
jan 1, 1967
47.242
-0.103
-0.22%
jan 1, 1968
47.139
-0.103
-0.22%
jan 1, 1969
47.039
-0.1
-0.21%
jan 1, 1970
46.934
-0.105
-0.22%
jan 1, 1971
46.806
-0.128
-0.27%
jan 1, 1972
46.629
-0.177
-0.38%
jan 1, 1973
46.386
-0.243
-0.52%
jan 1, 1974
46.071
-0.315
-0.68%
jan 1, 1975
45.69
-0.381
-0.83%
jan 1, 1976
45.27
-0.42
-0.92%
jan 1, 1977
44.849
-0.421
-0.93%
jan 1, 1978
44.457
-0.392
-0.87%
jan 1, 1979
44.105
-0.352
-0.79%
jan 1, 1980
43.784
-0.321
-0.73%
jan 1, 1981
43.46
-0.324
-0.74%
jan 1, 1982
43.086
-0.374
-0.86%
jan 1, 1983
42.618
-0.468
-1.09%
jan 1, 1984
42.024
-0.594
-1.39%
jan 1, 1985
41.3
-0.724
-1.72%
jan 1, 1986
40.454
-0.846
-2.05%
jan 1, 1987
39.511
-0.943
-2.33%
jan 1, 1988
38.515
-0.996
-2.52%
jan 1, 1989
37.505
-1.01
-2.62%
jan 1, 1990
36.502
-1.003
-2.67%
jan 1, 1991
35.517
-0.985
-2.7%
jan 1, 1992
34.554
-0.963
-2.71%
jan 1, 1993
33.601
-0.953
-2.76%
jan 1, 1994
32.654
-0.947
-2.82%
jan 1, 1995
31.716
-0.938
-2.87%
jan 1, 1996
30.784
-0.932
-2.94%
jan 1, 1997
29.853
-0.931
-3.02%
jan 1, 1998
28.925
-0.928
-3.11%
jan 1, 1999
28.009
-0.916
-3.17%
jan 1, 2000
27.118
-0.891
-3.18%
jan 1, 2001
26.275
-0.843
-3.11%
jan 1, 2002
25.507
-0.768
-2.92%
jan 1, 2003
24.829
-0.678
-2.66%
jan 1, 2004
24.246
-0.583
-2.35%
jan 1, 2005
23.755
-0.491
-2.03%
jan 1, 2006
23.347
-0.408
-1.72%
jan 1, 2007
23.003
-0.344
-1.47%
jan 1, 2008
22.695
-0.308
-1.34%
jan 1, 2009
22.395
-0.3
-1.32%
jan 1, 2010
22.087
-0.308
-1.38%
jan 1, 2011
21.754
-0.333
-1.51%
jan 1, 2012
21.388
-0.366
-1.68%
jan 1, 2013
20.993
-0.395
-1.85%
jan 1, 2014
20.576
-0.417
-1.99%
jan 1, 2015
20.139
-0.437
-2.12%
Ranking of countries by current statistics by years


Comments: