29
/
en
AIzaSyAYiBZKx7MnpbEhh9jyipgxe19OcubqV5w
April 1, 2024
26323
Early-demographic dividend
EAR
false
2
1
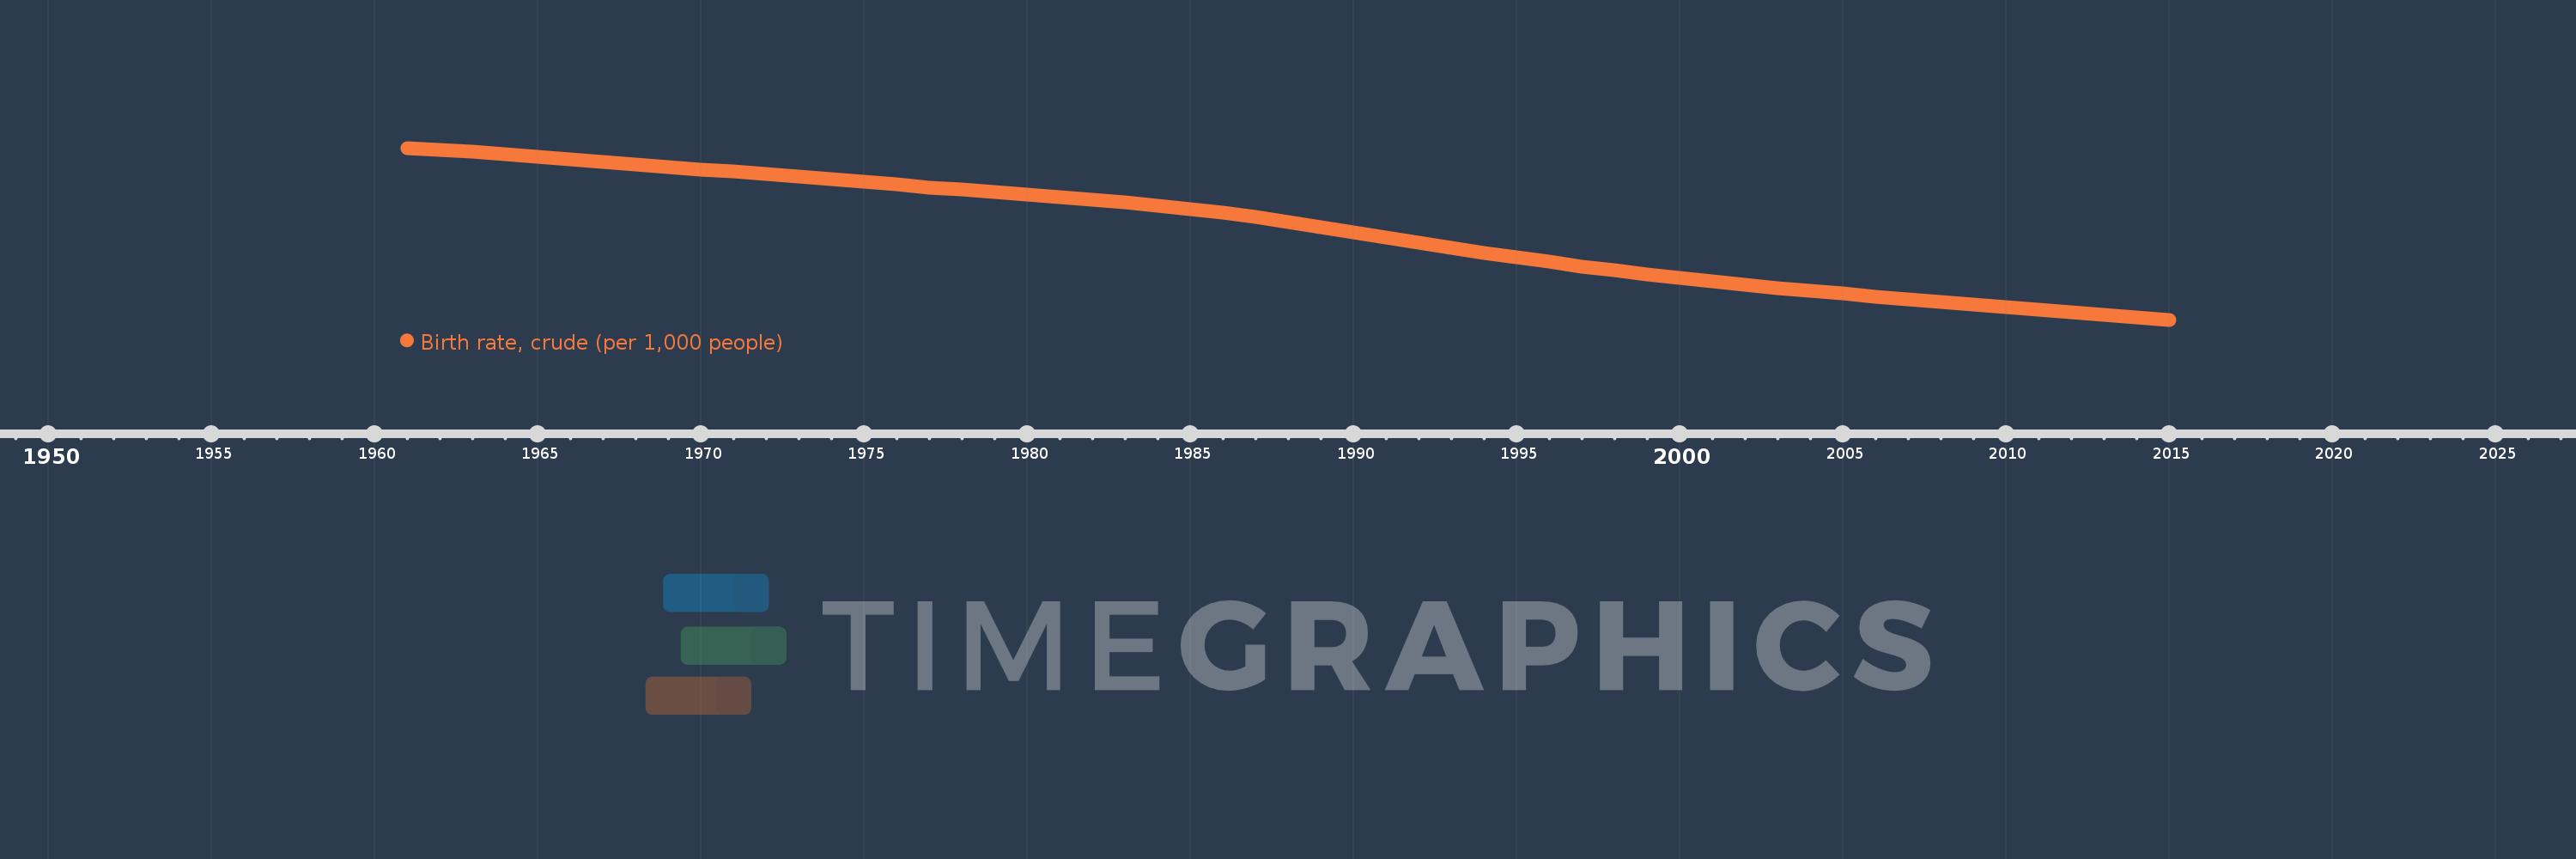
Birth rate, crude (per 1,000 people)
2015,2014,2013,2012,2011,2010,2009,2008,2007,2006,2005,2004,2003,2002,2001,2000,1999,1998,1997,1996,1995,1994,1993,1992,1991,1990,1989,1988,1987,1986,1985,1984,1983,1982,1981,1980,1979,1978,1977,1976,1975,1974,1973,1972,1971,1970,1969,1968,1967,1966,1965,1964,1963,1962,1961
This statistics in other country:
AfghanistanAlbaniaAlgeriaAmerican SamoaAndorraAngolaAntigua and BarbudaArab WorldArgentinaArmeniaArubaAustraliaAustriaAzerbaijanBahamas, TheBahrainBangladeshBarbadosBelarusBelgiumBelizeBeninBermudaBhutanBoliviaBosnia and HerzegovinaBotswanaBrazilBrunei DarussalamBulgariaBurkina FasoBurundiCabo VerdeCambodiaCameroonCanadaCaribbean small statesCayman IslandsCentral African RepublicCentral Europe and the BalticsChadChannel IslandsChileChinaColombiaComorosCongo, Dem. Rep.Congo, Rep.Costa RicaCote d'IvoireCroatiaCubaCuracaoCyprusCzech RepublicDenmarkDjiboutiDominicaDominican RepublicEarly-demographic dividendEast Asia & PacificEast Asia & Pacific (excluding high income)East Asia & Pacific (IDA & IBRD countries)EcuadorEgypt, Arab Rep.El SalvadorEquatorial GuineaEritreaEstoniaEthiopiaEuro areaEurope & Central AsiaEurope & Central Asia (excluding high income)Europe & Central Asia (IDA & IBRD countries)European UnionFaroe IslandsFijiFinlandFragile and conflict affected situationsFranceFrench PolynesiaGabonGambia, TheGeorgiaGermanyGhanaGreeceGreenlandGrenadaGuamGuatemalaGuineaGuinea-BissauGuyanaHaitiHeavily indebted poor countries (HIPC)High incomeHondurasHong Kong SAR, ChinaHungaryIBRD onlyIcelandIDA & IBRD totalIDA blendIDA onlyIDA totalIndiaIndonesiaIran, Islamic Rep.IraqIrelandIsle of ManIsraelItalyJamaicaJapanJordanKazakhstanKenyaKiribatiKorea, Dem. People’s Rep.Korea, Rep.KosovoKuwaitKyrgyz RepublicLao PDRLate-demographic dividendLatin America & Caribbean Latin America & Caribbean (excluding high income)Latin America & the Caribbean (IDA & IBRD countries)LatviaLeast developed countries: UN classificationLebanonLesothoLiberiaLibyaLiechtensteinLithuaniaLow & middle incomeLow incomeLower middle incomeLuxembourgMacao SAR, ChinaMacedonia, FYRMadagascarMalawiMalaysiaMaldivesMaliMaltaMarshall IslandsMauritaniaMauritiusMexicoMicronesia, Fed. Sts.Middle East & North AfricaMiddle East & North Africa (excluding high income)Middle East & North Africa (IDA & IBRD countries)Middle incomeMoldovaMonacoMongoliaMontenegroMoroccoMozambiqueMyanmarNamibiaNepalNetherlandsNew CaledoniaNew ZealandNicaraguaNigerNigeriaNorth AmericaNorwayOECD membersOmanOther small statesPacific island small statesPakistanPalauPanamaPapua New GuineaParaguayPeruPhilippinesPolandPortugalPost-demographic dividendPre-demographic dividendPuerto RicoQatarRomaniaRussian FederationRwandaSamoaSan MarinoSao Tome and PrincipeSaudi ArabiaSenegalSerbiaSeychellesSierra LeoneSingaporeSint Maarten (Dutch part)Slovak RepublicSloveniaSmall statesSolomon IslandsSomaliaSouth AfricaSouth AsiaSouth Asia (IDA & IBRD)South SudanSpainSri LankaSt. Kitts and NevisSt. LuciaSt. Martin (French part)St. Vincent and the GrenadinesSub-Saharan Africa Sub-Saharan Africa (excluding high income)Sub-Saharan Africa (IDA & IBRD countries)SudanSurinameSwazilandSwedenSwitzerlandSyrian Arab RepublicTajikistanTanzaniaThailandTimor-LesteTogoTongaTrinidad and TobagoTunisiaTurkeyTurkmenistanUgandaUkraineUnited Arab EmiratesUnited KingdomUnited StatesUpper middle incomeUruguayUzbekistanVanuatuVenezuela, RBVietnamVirgin Islands (U.S.)West Bank and GazaWorldYemen, Rep.ZambiaZimbabwe Timeline:
This timeline shows a graph from 1961 to 2015 of Early-demographic dividend. No data until 1960. Number of actual observations by date: 55.
Source name:
World Development Indicators
Source organization:
(1) United Nations Population Division. World Population Prospects, (2) Census reports and other statistical publications from national statistical offices, (3) Eurostat: Demographic Statistics, (4) United Nations Statistical Division. Population and Vital Statistics Reprot (various years), (5) U.S. Census Bureau: International Database, and (6) Secretariat of the Pacific Community: Statistics and Demography Programme.
Categories, topics:
Health
Last updated:
apr 23, 2017
Indicators value changes by year
Minimum:
21.672
jan 1, 2015
Maximum:
43.681
jan 1, 1961
At the date of observation
Value
Absolute change
Change from previous value
jan 1, 1961
43.681
+43.681
0.0%
jan 1, 1962
43.431
-0.25
-0.57%
jan 1, 1963
43.158
-0.274
-0.63%
jan 1, 1964
42.861
-0.297
-0.69%
jan 1, 1965
42.547
-0.314
-0.73%
jan 1, 1966
42.221
-0.326
-0.77%
jan 1, 1967
41.891
-0.33
-0.78%
jan 1, 1968
41.56
-0.331
-0.79%
jan 1, 1969
41.243
-0.317
-0.76%
jan 1, 1970
40.931
-0.311
-0.75%
jan 1, 1971
40.623
-0.308
-0.75%
jan 1, 1972
40.317
-0.307
-0.75%
jan 1, 1973
39.995
-0.321
-0.8%
jan 1, 1974
39.663
-0.333
-0.83%
jan 1, 1975
39.321
-0.342
-0.86%
jan 1, 1976
38.976
-0.345
-0.88%
jan 1, 1977
38.64
-0.337
-0.86%
jan 1, 1978
38.313
-0.326
-0.84%
jan 1, 1979
38.002
-0.311
-0.81%
jan 1, 1980
37.683
-0.319
-0.84%
jan 1, 1981
37.378
-0.305
-0.81%
jan 1, 1982
37.07
-0.308
-0.82%
jan 1, 1983
36.719
-0.351
-0.95%
jan 1, 1984
36.323
-0.396
-1.08%
jan 1, 1985
35.879
-0.444
-1.22%
jan 1, 1986
35.38
-0.499
-1.39%
jan 1, 1987
34.818
-0.562
-1.59%
jan 1, 1988
34.201
-0.618
-1.77%
jan 1, 1989
33.542
-0.659
-1.93%
jan 1, 1990
32.862
-0.679
-2.03%
jan 1, 1991
32.214
-0.648
-1.97%
jan 1, 1992
31.559
-0.655
-2.03%
jan 1, 1993
30.897
-0.661
-2.1%
jan 1, 1994
30.254
-0.644
-2.08%
jan 1, 1995
29.633
-0.621
-2.05%
jan 1, 1996
29.071
-0.562
-1.9%
jan 1, 1997
28.513
-0.557
-1.92%
jan 1, 1998
27.993
-0.521
-1.83%
jan 1, 1999
27.493
-0.5
-1.78%
jan 1, 2000
27.025
-0.468
-1.7%
jan 1, 2001
26.579
-0.445
-1.65%
jan 1, 2002
26.152
-0.427
-1.61%
jan 1, 2003
25.758
-0.394
-1.51%
jan 1, 2004
25.363
-0.395
-1.53%
jan 1, 2005
25.0
-0.364
-1.43%
jan 1, 2006
24.631
-0.369
-1.47%
jan 1, 2007
24.285
-0.347
-1.41%
jan 1, 2008
23.956
-0.328
-1.35%
jan 1, 2009
23.628
-0.328
-1.37%
jan 1, 2010
23.294
-0.334
-1.42%
jan 1, 2011
22.96
-0.334
-1.43%
jan 1, 2012
22.621
-0.339
-1.48%
jan 1, 2013
22.293
-0.328
-1.45%
jan 1, 2014
21.985
-0.308
-1.38%
jan 1, 2015
21.672
-0.314
-1.43%
Ranking of countries by current statistics by years


Comments: