29
/
en
AIzaSyAYiBZKx7MnpbEhh9jyipgxe19OcubqV5w
April 1, 2024
63272
Afghanistan
AFG
true
2
1
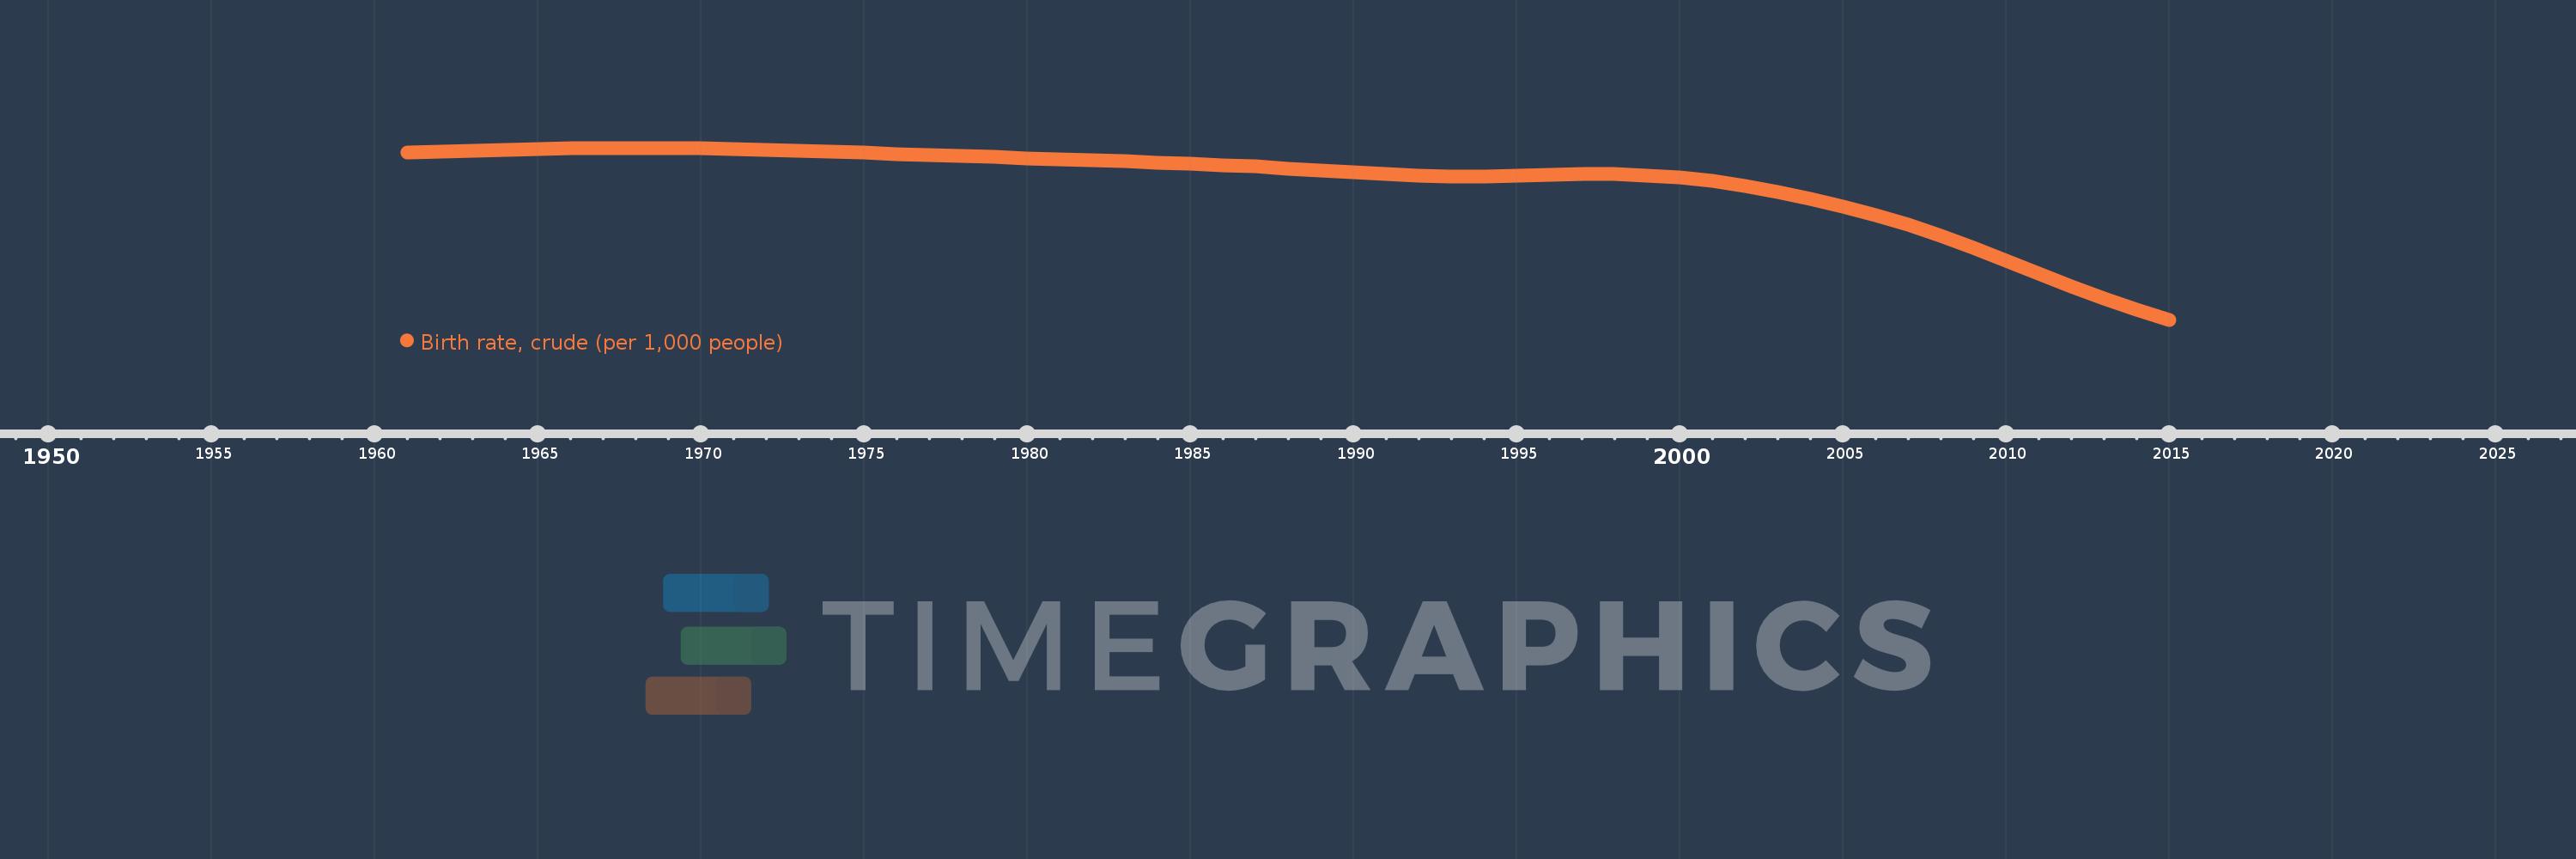
Birth rate, crude (per 1,000 people)
2015,2014,2013,2012,2011,2010,2009,2008,2007,2006,2005,2004,2003,2002,2001,2000,1999,1998,1997,1996,1995,1994,1993,1992,1991,1990,1989,1988,1987,1986,1985,1984,1983,1982,1981,1980,1979,1978,1977,1976,1975,1974,1973,1972,1971,1970,1969,1968,1967,1966,1965,1964,1963,1962,1961
This statistics in other country:
AfghanistanAlbaniaAlgeriaAmerican SamoaAndorraAngolaAntigua and BarbudaArab WorldArgentinaArmeniaArubaAustraliaAustriaAzerbaijanBahamas, TheBahrainBangladeshBarbadosBelarusBelgiumBelizeBeninBermudaBhutanBoliviaBosnia and HerzegovinaBotswanaBrazilBrunei DarussalamBulgariaBurkina FasoBurundiCabo VerdeCambodiaCameroonCanadaCaribbean small statesCayman IslandsCentral African RepublicCentral Europe and the BalticsChadChannel IslandsChileChinaColombiaComorosCongo, Dem. Rep.Congo, Rep.Costa RicaCote d'IvoireCroatiaCubaCuracaoCyprusCzech RepublicDenmarkDjiboutiDominicaDominican RepublicEarly-demographic dividendEast Asia & PacificEast Asia & Pacific (excluding high income)East Asia & Pacific (IDA & IBRD countries)EcuadorEgypt, Arab Rep.El SalvadorEquatorial GuineaEritreaEstoniaEthiopiaEuro areaEurope & Central AsiaEurope & Central Asia (excluding high income)Europe & Central Asia (IDA & IBRD countries)European UnionFaroe IslandsFijiFinlandFragile and conflict affected situationsFranceFrench PolynesiaGabonGambia, TheGeorgiaGermanyGhanaGreeceGreenlandGrenadaGuamGuatemalaGuineaGuinea-BissauGuyanaHaitiHeavily indebted poor countries (HIPC)High incomeHondurasHong Kong SAR, ChinaHungaryIBRD onlyIcelandIDA & IBRD totalIDA blendIDA onlyIDA totalIndiaIndonesiaIran, Islamic Rep.IraqIrelandIsle of ManIsraelItalyJamaicaJapanJordanKazakhstanKenyaKiribatiKorea, Dem. People’s Rep.Korea, Rep.KosovoKuwaitKyrgyz RepublicLao PDRLate-demographic dividendLatin America & Caribbean Latin America & Caribbean (excluding high income)Latin America & the Caribbean (IDA & IBRD countries)LatviaLeast developed countries: UN classificationLebanonLesothoLiberiaLibyaLiechtensteinLithuaniaLow & middle incomeLow incomeLower middle incomeLuxembourgMacao SAR, ChinaMacedonia, FYRMadagascarMalawiMalaysiaMaldivesMaliMaltaMarshall IslandsMauritaniaMauritiusMexicoMicronesia, Fed. Sts.Middle East & North AfricaMiddle East & North Africa (excluding high income)Middle East & North Africa (IDA & IBRD countries)Middle incomeMoldovaMonacoMongoliaMontenegroMoroccoMozambiqueMyanmarNamibiaNepalNetherlandsNew CaledoniaNew ZealandNicaraguaNigerNigeriaNorth AmericaNorwayOECD membersOmanOther small statesPacific island small statesPakistanPalauPanamaPapua New GuineaParaguayPeruPhilippinesPolandPortugalPost-demographic dividendPre-demographic dividendPuerto RicoQatarRomaniaRussian FederationRwandaSamoaSan MarinoSao Tome and PrincipeSaudi ArabiaSenegalSerbiaSeychellesSierra LeoneSingaporeSint Maarten (Dutch part)Slovak RepublicSloveniaSmall statesSolomon IslandsSomaliaSouth AfricaSouth AsiaSouth Asia (IDA & IBRD)South SudanSpainSri LankaSt. Kitts and NevisSt. LuciaSt. Martin (French part)St. Vincent and the GrenadinesSub-Saharan Africa Sub-Saharan Africa (excluding high income)Sub-Saharan Africa (IDA & IBRD countries)SudanSurinameSwazilandSwedenSwitzerlandSyrian Arab RepublicTajikistanTanzaniaThailandTimor-LesteTogoTongaTrinidad and TobagoTunisiaTurkeyTurkmenistanUgandaUkraineUnited Arab EmiratesUnited KingdomUnited StatesUpper middle incomeUruguayUzbekistanVanuatuVenezuela, RBVietnamVirgin Islands (U.S.)West Bank and GazaWorldYemen, Rep.ZambiaZimbabwe Timeline:
This timeline shows a graph from 1961 to 2015 of Afghanistan. No data until 1960. Number of actual observations by date: 55.
Source name:
World Development Indicators
Source organization:
(1) United Nations Population Division. World Population Prospects, (2) Census reports and other statistical publications from national statistical offices, (3) Eurostat: Demographic Statistics, (4) United Nations Statistical Division. Population and Vital Statistics Reprot (various years), (5) U.S. Census Bureau: International Database, and (6) Secretariat of the Pacific Community: Statistics and Demography Programme.
Categories, topics:
Health
Last updated:
apr 23, 2017
Indicators value changes by year
Minimum:
34.225
jan 1, 2015
Maximum:
51.716
jan 1, 1968
At the date of observation
Value
Absolute change
Change from previous value
jan 1, 1961
51.276
+51.276
0.0%
jan 1, 1962
51.374
+0.098
0.19%
jan 1, 1963
51.464
+0.09
0.18%
jan 1, 1964
51.544
+0.08
0.16%
jan 1, 1965
51.614
+0.07
0.14%
jan 1, 1966
51.668
+0.054
0.1%
jan 1, 1967
51.703
+0.035
0.07%
jan 1, 1968
51.716
+0.013
0.03%
jan 1, 1969
51.705
-0.011
-0.02%
jan 1, 1970
51.672
-0.033
-0.06%
jan 1, 1971
51.616
-0.056
-0.11%
jan 1, 1972
51.539
-0.077
-0.15%
jan 1, 1973
51.446
-0.093
-0.18%
jan 1, 1974
51.341
-0.105
-0.2%
jan 1, 1975
51.229
-0.112
-0.22%
jan 1, 1976
51.113
-0.116
-0.23%
jan 1, 1977
50.998
-0.115
-0.22%
jan 1, 1978
50.886
-0.112
-0.22%
jan 1, 1979
50.775
-0.111
-0.22%
jan 1, 1980
50.667
-0.108
-0.21%
jan 1, 1981
50.562
-0.105
-0.21%
jan 1, 1982
50.457
-0.105
-0.21%
jan 1, 1983
50.349
-0.108
-0.21%
jan 1, 1984
50.235
-0.114
-0.23%
jan 1, 1985
50.113
-0.122
-0.24%
jan 1, 1986
49.975
-0.138
-0.28%
jan 1, 1987
49.813
-0.162
-0.32%
jan 1, 1988
49.627
-0.186
-0.37%
jan 1, 1989
49.425
-0.202
-0.41%
jan 1, 1990
49.216
-0.209
-0.42%
jan 1, 1991
49.029
-0.187
-0.38%
jan 1, 1992
48.896
-0.133
-0.27%
jan 1, 1993
48.834
-0.062
-0.13%
jan 1, 1994
48.839
+0.005
0.01%
jan 1, 1995
48.898
+0.059
0.12%
jan 1, 1996
48.978
+0.08
0.16%
jan 1, 1997
49.039
+0.061
0.12%
jan 1, 1998
49.036
-0.003
-0.01%
jan 1, 1999
48.93
-0.106
-0.22%
jan 1, 2000
48.699
-0.231
-0.47%
jan 1, 2001
48.332
-0.367
-0.75%
jan 1, 2002
47.835
-0.497
-1.03%
jan 1, 2003
47.23
-0.605
-1.26%
jan 1, 2004
46.538
-0.692
-1.47%
jan 1, 2005
45.761
-0.777
-1.67%
jan 1, 2006
44.887
-0.874
-1.91%
jan 1, 2007
43.893
-0.994
-2.21%
jan 1, 2008
42.779
-1.114
-2.54%
jan 1, 2009
41.56
-1.219
-2.85%
jan 1, 2010
40.265
-1.295
-3.12%
jan 1, 2011
38.94
-1.325
-3.29%
jan 1, 2012
37.636
-1.304
-3.35%
jan 1, 2013
36.396
-1.24
-3.29%
jan 1, 2014
35.253
-1.143
-3.14%
jan 1, 2015
34.225
-1.028
-2.92%
Ranking of countries by current statistics by years


Comments: