29
/
en
AIzaSyAYiBZKx7MnpbEhh9jyipgxe19OcubqV5w
April 1, 2024
75962
Bahamas, The
BHS
true
2
1
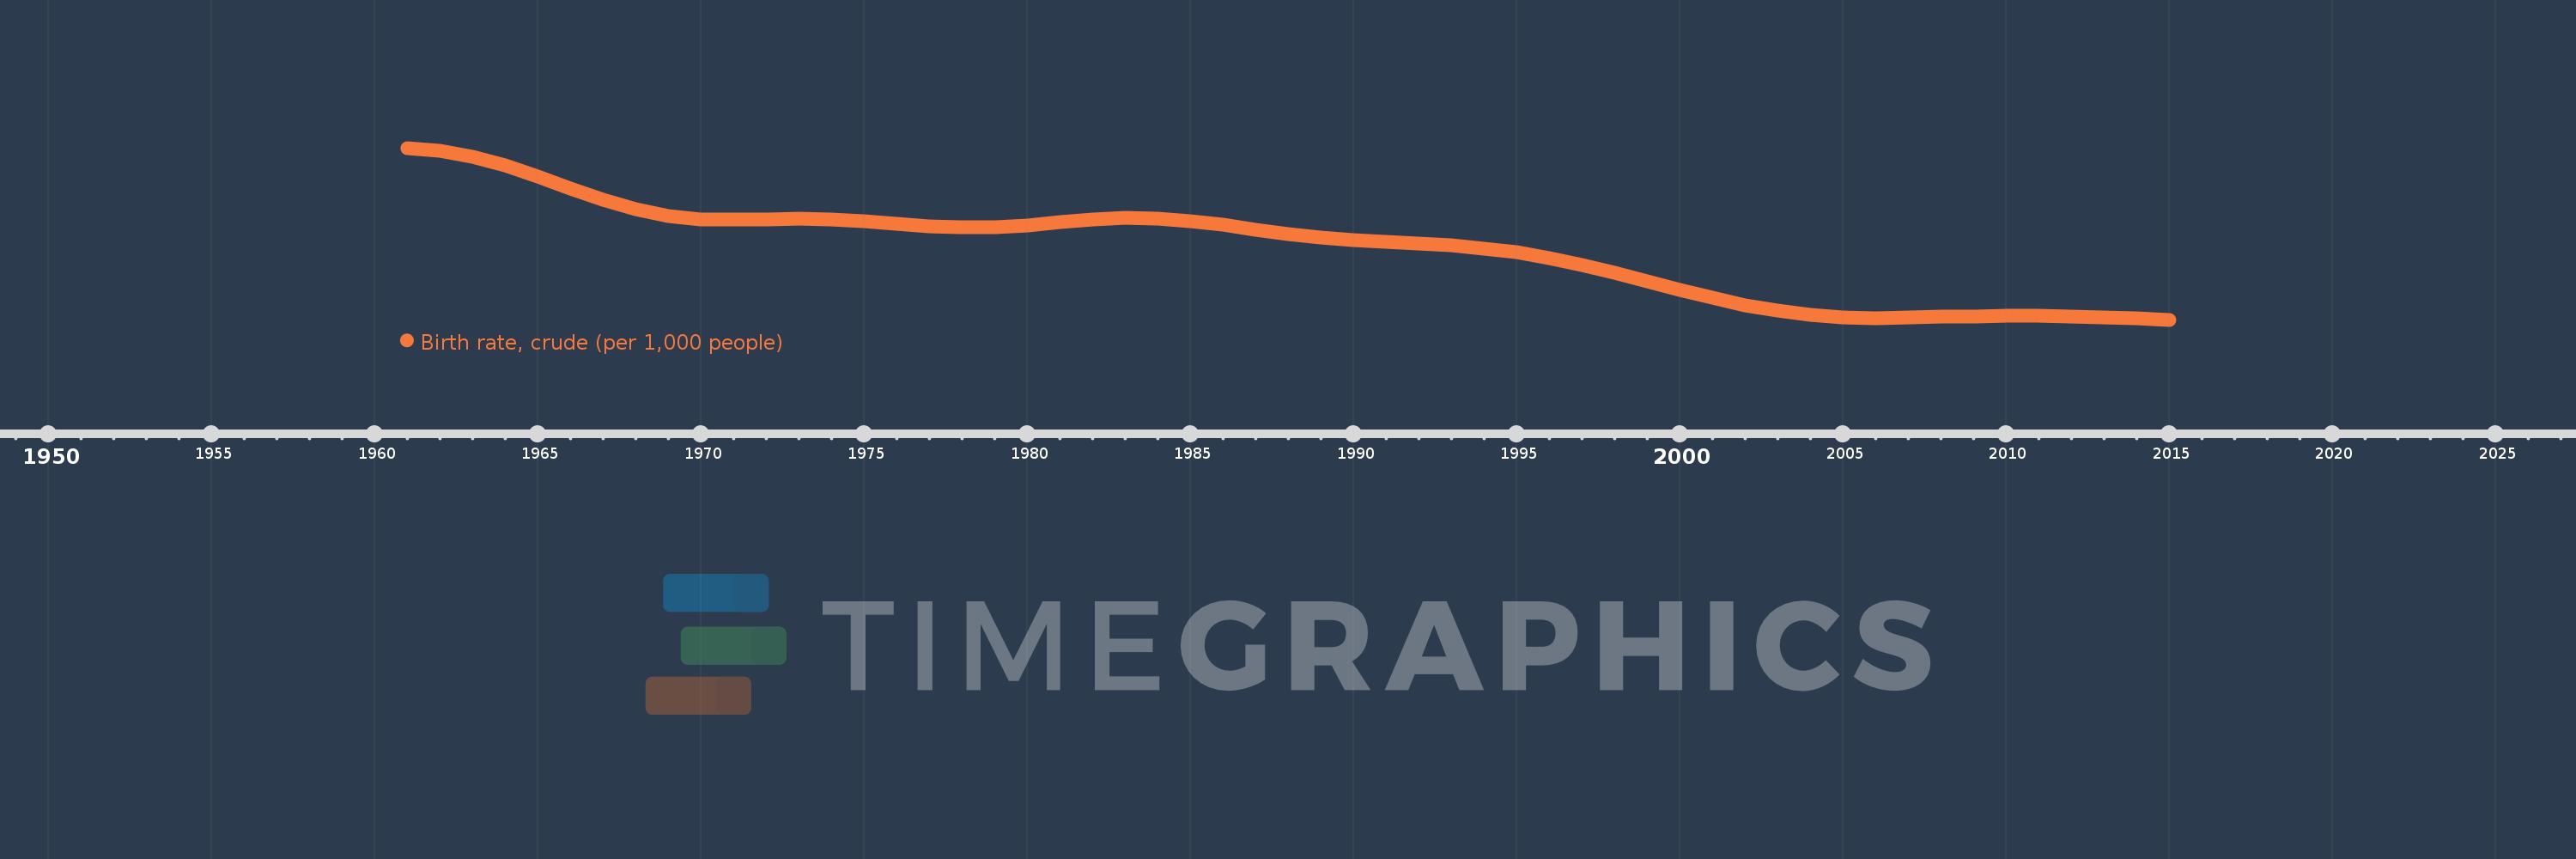
Birth rate, crude (per 1,000 people)
2015,2014,2013,2012,2011,2010,2009,2008,2007,2006,2005,2004,2003,2002,2001,2000,1999,1998,1997,1996,1995,1994,1993,1992,1991,1990,1989,1988,1987,1986,1985,1984,1983,1982,1981,1980,1979,1978,1977,1976,1975,1974,1973,1972,1971,1970,1969,1968,1967,1966,1965,1964,1963,1962,1961
This statistics in other country:
AfghanistanAlbaniaAlgeriaAmerican SamoaAndorraAngolaAntigua and BarbudaArab WorldArgentinaArmeniaArubaAustraliaAustriaAzerbaijanBahamas, TheBahrainBangladeshBarbadosBelarusBelgiumBelizeBeninBermudaBhutanBoliviaBosnia and HerzegovinaBotswanaBrazilBrunei DarussalamBulgariaBurkina FasoBurundiCabo VerdeCambodiaCameroonCanadaCaribbean small statesCayman IslandsCentral African RepublicCentral Europe and the BalticsChadChannel IslandsChileChinaColombiaComorosCongo, Dem. Rep.Congo, Rep.Costa RicaCote d'IvoireCroatiaCubaCuracaoCyprusCzech RepublicDenmarkDjiboutiDominicaDominican RepublicEarly-demographic dividendEast Asia & PacificEast Asia & Pacific (excluding high income)East Asia & Pacific (IDA & IBRD countries)EcuadorEgypt, Arab Rep.El SalvadorEquatorial GuineaEritreaEstoniaEthiopiaEuro areaEurope & Central AsiaEurope & Central Asia (excluding high income)Europe & Central Asia (IDA & IBRD countries)European UnionFaroe IslandsFijiFinlandFragile and conflict affected situationsFranceFrench PolynesiaGabonGambia, TheGeorgiaGermanyGhanaGreeceGreenlandGrenadaGuamGuatemalaGuineaGuinea-BissauGuyanaHaitiHeavily indebted poor countries (HIPC)High incomeHondurasHong Kong SAR, ChinaHungaryIBRD onlyIcelandIDA & IBRD totalIDA blendIDA onlyIDA totalIndiaIndonesiaIran, Islamic Rep.IraqIrelandIsle of ManIsraelItalyJamaicaJapanJordanKazakhstanKenyaKiribatiKorea, Dem. People’s Rep.Korea, Rep.KosovoKuwaitKyrgyz RepublicLao PDRLate-demographic dividendLatin America & Caribbean Latin America & Caribbean (excluding high income)Latin America & the Caribbean (IDA & IBRD countries)LatviaLeast developed countries: UN classificationLebanonLesothoLiberiaLibyaLiechtensteinLithuaniaLow & middle incomeLow incomeLower middle incomeLuxembourgMacao SAR, ChinaMacedonia, FYRMadagascarMalawiMalaysiaMaldivesMaliMaltaMarshall IslandsMauritaniaMauritiusMexicoMicronesia, Fed. Sts.Middle East & North AfricaMiddle East & North Africa (excluding high income)Middle East & North Africa (IDA & IBRD countries)Middle incomeMoldovaMonacoMongoliaMontenegroMoroccoMozambiqueMyanmarNamibiaNepalNetherlandsNew CaledoniaNew ZealandNicaraguaNigerNigeriaNorth AmericaNorwayOECD membersOmanOther small statesPacific island small statesPakistanPalauPanamaPapua New GuineaParaguayPeruPhilippinesPolandPortugalPost-demographic dividendPre-demographic dividendPuerto RicoQatarRomaniaRussian FederationRwandaSamoaSan MarinoSao Tome and PrincipeSaudi ArabiaSenegalSerbiaSeychellesSierra LeoneSingaporeSint Maarten (Dutch part)Slovak RepublicSloveniaSmall statesSolomon IslandsSomaliaSouth AfricaSouth AsiaSouth Asia (IDA & IBRD)South SudanSpainSri LankaSt. Kitts and NevisSt. LuciaSt. Martin (French part)St. Vincent and the GrenadinesSub-Saharan Africa Sub-Saharan Africa (excluding high income)Sub-Saharan Africa (IDA & IBRD countries)SudanSurinameSwazilandSwedenSwitzerlandSyrian Arab RepublicTajikistanTanzaniaThailandTimor-LesteTogoTongaTrinidad and TobagoTunisiaTurkeyTurkmenistanUgandaUkraineUnited Arab EmiratesUnited KingdomUnited StatesUpper middle incomeUruguayUzbekistanVanuatuVenezuela, RBVietnamVirgin Islands (U.S.)West Bank and GazaWorldYemen, Rep.ZambiaZimbabwe Timeline:
This timeline shows a graph from 1961 to 2015 of Bahamas, The. No data until 1960. Number of actual observations by date: 55.
Source name:
World Development Indicators
Source organization:
(1) United Nations Population Division. World Population Prospects, (2) Census reports and other statistical publications from national statistical offices, (3) Eurostat: Demographic Statistics, (4) United Nations Statistical Division. Population and Vital Statistics Reprot (various years), (5) U.S. Census Bureau: International Database, and (6) Secretariat of the Pacific Community: Statistics and Demography Programme.
Categories, topics:
Health
Last updated:
apr 23, 2017
Indicators value changes by year
Minimum:
15.199
jan 1, 2015
Maximum:
34.388
jan 1, 1961
At the date of observation
Value
Absolute change
Change from previous value
jan 1, 1961
34.388
+34.388
0.0%
jan 1, 1962
34.036
-0.352
-1.02%
jan 1, 1963
33.381
-0.655
-1.92%
jan 1, 1964
32.417
-0.964
-2.89%
jan 1, 1965
31.2
-1.217
-3.75%
jan 1, 1966
29.865
-1.335
-4.28%
jan 1, 1967
28.595
-1.27
-4.25%
jan 1, 1968
27.547
-1.048
-3.66%
jan 1, 1969
26.821
-0.726
-2.64%
jan 1, 1970
26.442
-0.379
-1.41%
jan 1, 1971
26.348
-0.094
-0.36%
jan 1, 1972
26.412
+0.064
0.24%
jan 1, 1973
26.47
+0.058
0.22%
jan 1, 1974
26.41
-0.06
-0.23%
jan 1, 1975
26.209
-0.201
-0.76%
jan 1, 1976
25.919
-0.29
-1.11%
jan 1, 1977
25.645
-0.274
-1.06%
jan 1, 1978
25.5
-0.145
-0.57%
jan 1, 1979
25.547
+0.047
0.18%
jan 1, 1980
25.77
+0.223
0.87%
jan 1, 1981
26.094
+0.324
1.26%
jan 1, 1982
26.398
+0.304
1.17%
jan 1, 1983
26.565
+0.167
0.63%
jan 1, 1984
26.52
-0.045
-0.17%
jan 1, 1985
26.251
-0.269
-1.01%
jan 1, 1986
25.804
-0.447
-1.7%
jan 1, 1987
25.272
-0.532
-2.06%
jan 1, 1988
24.764
-0.508
-2.01%
jan 1, 1989
24.357
-0.407
-1.64%
jan 1, 1990
24.064
-0.293
-1.2%
jan 1, 1991
23.864
-0.2
-0.83%
jan 1, 1992
23.7
-0.164
-0.69%
jan 1, 1993
23.49
-0.21
-0.89%
jan 1, 1994
23.17
-0.32
-1.36%
jan 1, 1995
22.719
-0.451
-1.95%
jan 1, 1996
22.112
-0.607
-2.67%
jan 1, 1997
21.345
-0.767
-3.47%
jan 1, 1998
20.457
-0.888
-4.16%
jan 1, 1999
19.506
-0.951
-4.65%
jan 1, 2000
18.536
-0.97
-4.97%
jan 1, 2001
17.619
-0.917
-4.95%
jan 1, 2002
16.825
-0.794
-4.51%
jan 1, 2003
16.195
-0.63
-3.74%
jan 1, 2004
15.749
-0.446
-2.75%
jan 1, 2005
15.491
-0.258
-1.64%
jan 1, 2006
15.4
-0.091
-0.59%
jan 1, 2007
15.432
+0.032
0.21%
jan 1, 2008
15.519
+0.087
0.56%
jan 1, 2009
15.601
+0.082
0.53%
jan 1, 2010
15.647
+0.046
0.29%
jan 1, 2011
15.637
-0.01
-0.06%
jan 1, 2012
15.569
-0.068
-0.43%
jan 1, 2013
15.464
-0.105
-0.67%
jan 1, 2014
15.339
-0.125
-0.81%
jan 1, 2015
15.199
-0.14
-0.91%
Ranking of countries by current statistics by years


Comments: