29
/
en
AIzaSyAYiBZKx7MnpbEhh9jyipgxe19OcubqV5w
April 1, 2024
89524
Botswana
BWA
true
2
1
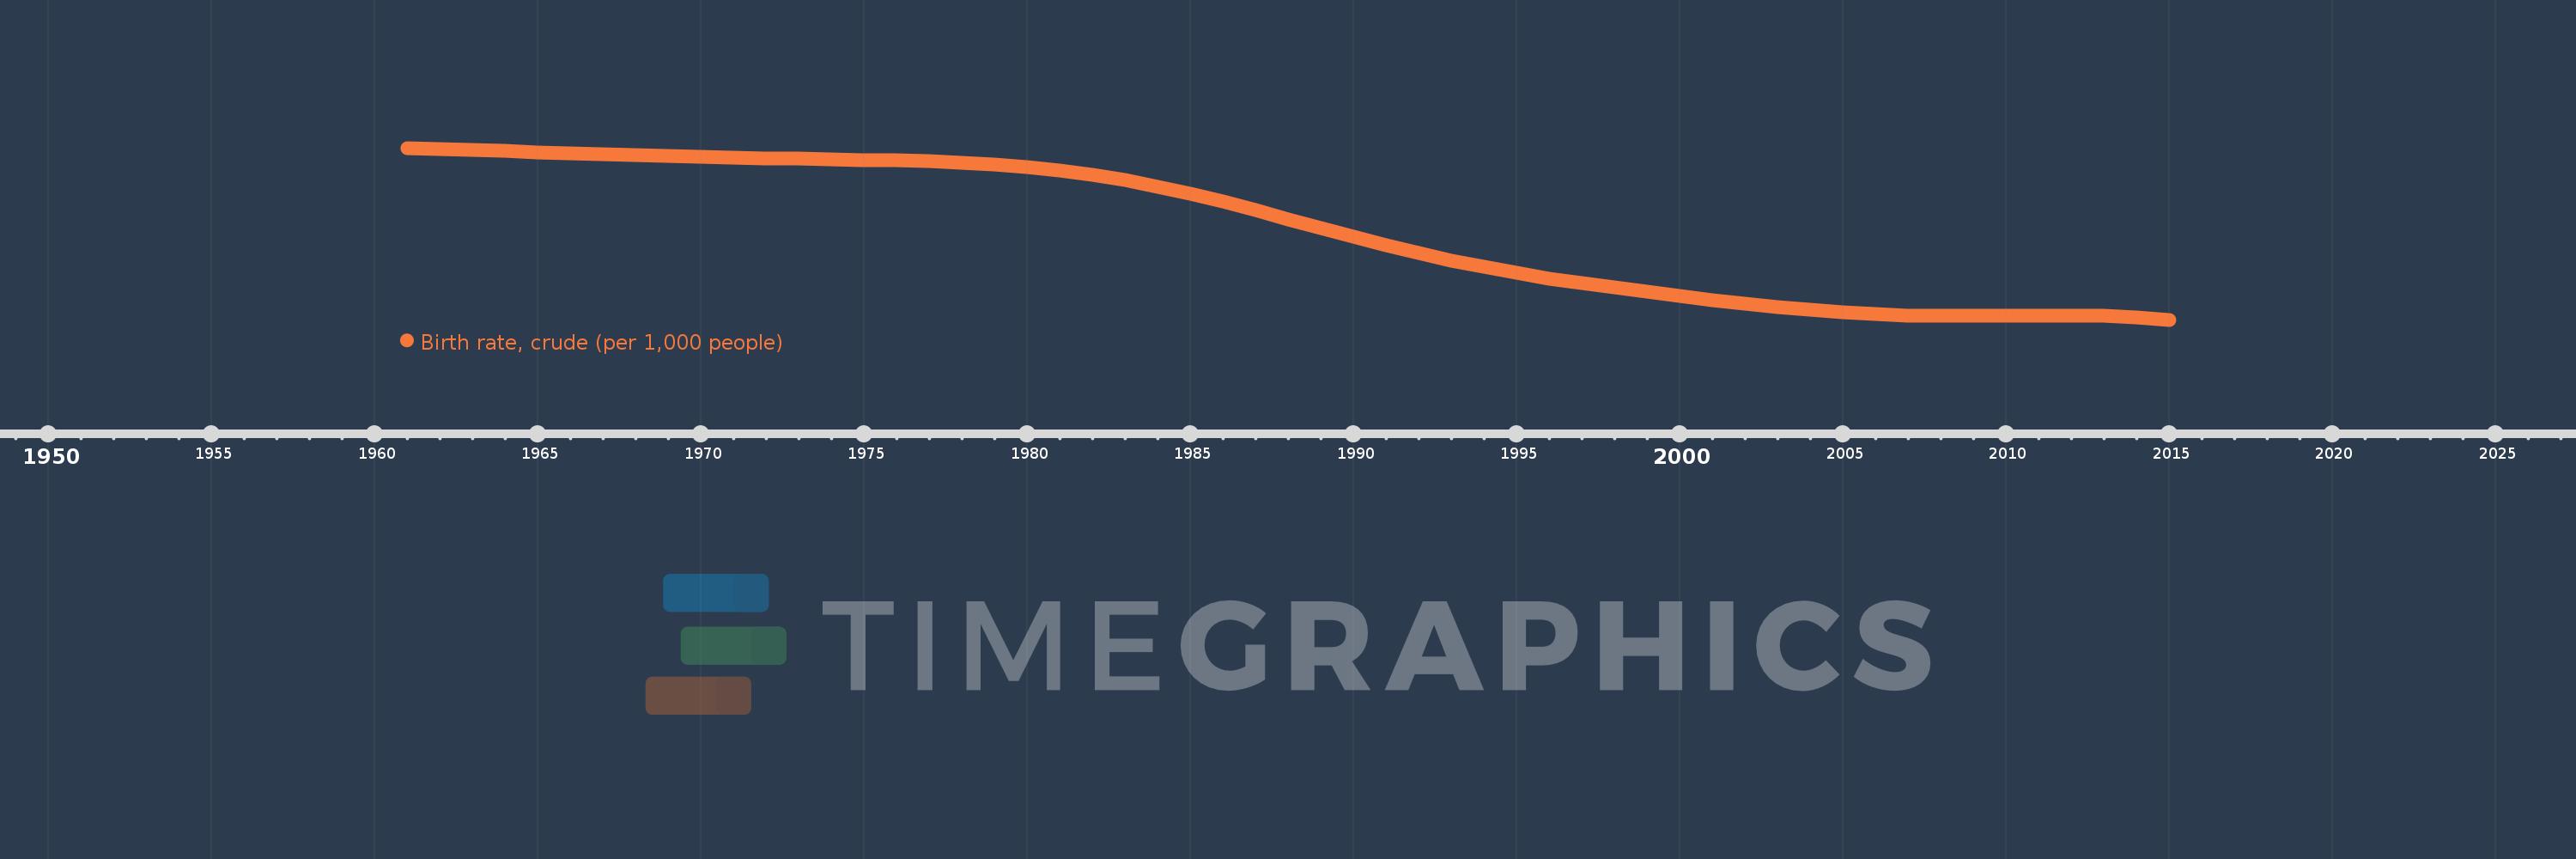
Birth rate, crude (per 1,000 people)
2015,2014,2013,2012,2011,2010,2009,2008,2007,2006,2005,2004,2003,2002,2001,2000,1999,1998,1997,1996,1995,1994,1993,1992,1991,1990,1989,1988,1987,1986,1985,1984,1983,1982,1981,1980,1979,1978,1977,1976,1975,1974,1973,1972,1971,1970,1969,1968,1967,1966,1965,1964,1963,1962,1961
This statistics in other country:
AfghanistanAlbaniaAlgeriaAmerican SamoaAndorraAngolaAntigua and BarbudaArab WorldArgentinaArmeniaArubaAustraliaAustriaAzerbaijanBahamas, TheBahrainBangladeshBarbadosBelarusBelgiumBelizeBeninBermudaBhutanBoliviaBosnia and HerzegovinaBotswanaBrazilBrunei DarussalamBulgariaBurkina FasoBurundiCabo VerdeCambodiaCameroonCanadaCaribbean small statesCayman IslandsCentral African RepublicCentral Europe and the BalticsChadChannel IslandsChileChinaColombiaComorosCongo, Dem. Rep.Congo, Rep.Costa RicaCote d'IvoireCroatiaCubaCuracaoCyprusCzech RepublicDenmarkDjiboutiDominicaDominican RepublicEarly-demographic dividendEast Asia & PacificEast Asia & Pacific (excluding high income)East Asia & Pacific (IDA & IBRD countries)EcuadorEgypt, Arab Rep.El SalvadorEquatorial GuineaEritreaEstoniaEthiopiaEuro areaEurope & Central AsiaEurope & Central Asia (excluding high income)Europe & Central Asia (IDA & IBRD countries)European UnionFaroe IslandsFijiFinlandFragile and conflict affected situationsFranceFrench PolynesiaGabonGambia, TheGeorgiaGermanyGhanaGreeceGreenlandGrenadaGuamGuatemalaGuineaGuinea-BissauGuyanaHaitiHeavily indebted poor countries (HIPC)High incomeHondurasHong Kong SAR, ChinaHungaryIBRD onlyIcelandIDA & IBRD totalIDA blendIDA onlyIDA totalIndiaIndonesiaIran, Islamic Rep.IraqIrelandIsle of ManIsraelItalyJamaicaJapanJordanKazakhstanKenyaKiribatiKorea, Dem. People’s Rep.Korea, Rep.KosovoKuwaitKyrgyz RepublicLao PDRLate-demographic dividendLatin America & Caribbean Latin America & Caribbean (excluding high income)Latin America & the Caribbean (IDA & IBRD countries)LatviaLeast developed countries: UN classificationLebanonLesothoLiberiaLibyaLiechtensteinLithuaniaLow & middle incomeLow incomeLower middle incomeLuxembourgMacao SAR, ChinaMacedonia, FYRMadagascarMalawiMalaysiaMaldivesMaliMaltaMarshall IslandsMauritaniaMauritiusMexicoMicronesia, Fed. Sts.Middle East & North AfricaMiddle East & North Africa (excluding high income)Middle East & North Africa (IDA & IBRD countries)Middle incomeMoldovaMonacoMongoliaMontenegroMoroccoMozambiqueMyanmarNamibiaNepalNetherlandsNew CaledoniaNew ZealandNicaraguaNigerNigeriaNorth AmericaNorwayOECD membersOmanOther small statesPacific island small statesPakistanPalauPanamaPapua New GuineaParaguayPeruPhilippinesPolandPortugalPost-demographic dividendPre-demographic dividendPuerto RicoQatarRomaniaRussian FederationRwandaSamoaSan MarinoSao Tome and PrincipeSaudi ArabiaSenegalSerbiaSeychellesSierra LeoneSingaporeSint Maarten (Dutch part)Slovak RepublicSloveniaSmall statesSolomon IslandsSomaliaSouth AfricaSouth AsiaSouth Asia (IDA & IBRD)South SudanSpainSri LankaSt. Kitts and NevisSt. LuciaSt. Martin (French part)St. Vincent and the GrenadinesSub-Saharan Africa Sub-Saharan Africa (excluding high income)Sub-Saharan Africa (IDA & IBRD countries)SudanSurinameSwazilandSwedenSwitzerlandSyrian Arab RepublicTajikistanTanzaniaThailandTimor-LesteTogoTongaTrinidad and TobagoTunisiaTurkeyTurkmenistanUgandaUkraineUnited Arab EmiratesUnited KingdomUnited StatesUpper middle incomeUruguayUzbekistanVanuatuVenezuela, RBVietnamVirgin Islands (U.S.)West Bank and GazaWorldYemen, Rep.ZambiaZimbabwe Timeline:
This timeline shows a graph from 1961 to 2015 of Botswana. No data until 1960. Number of actual observations by date: 55.
Source name:
World Development Indicators
Source organization:
(1) United Nations Population Division. World Population Prospects, (2) Census reports and other statistical publications from national statistical offices, (3) Eurostat: Demographic Statistics, (4) United Nations Statistical Division. Population and Vital Statistics Reprot (various years), (5) U.S. Census Bureau: International Database, and (6) Secretariat of the Pacific Community: Statistics and Demography Programme.
Categories, topics:
Health
Last updated:
apr 23, 2017
Indicators value changes by year
Minimum:
24.972
jan 1, 2015
Maximum:
46.992
jan 1, 1961
At the date of observation
Value
Absolute change
Change from previous value
jan 1, 1961
46.992
+46.992
0.0%
jan 1, 1962
46.855
-0.137
-0.29%
jan 1, 1963
46.713
-0.142
-0.3%
jan 1, 1964
46.577
-0.136
-0.29%
jan 1, 1965
46.452
-0.125
-0.27%
jan 1, 1966
46.337
-0.115
-0.25%
jan 1, 1967
46.23
-0.107
-0.23%
jan 1, 1968
46.122
-0.108
-0.23%
jan 1, 1969
46.008
-0.114
-0.25%
jan 1, 1970
45.889
-0.119
-0.26%
jan 1, 1971
45.772
-0.117
-0.25%
jan 1, 1972
45.671
-0.101
-0.22%
jan 1, 1973
45.59
-0.081
-0.18%
jan 1, 1974
45.522
-0.068
-0.15%
jan 1, 1975
45.457
-0.065
-0.14%
jan 1, 1976
45.379
-0.078
-0.17%
jan 1, 1977
45.271
-0.108
-0.24%
jan 1, 1978
45.111
-0.16
-0.35%
jan 1, 1979
44.878
-0.233
-0.52%
jan 1, 1980
44.553
-0.325
-0.72%
jan 1, 1981
44.114
-0.439
-0.99%
jan 1, 1982
43.542
-0.572
-1.3%
jan 1, 1983
42.841
-0.701
-1.61%
jan 1, 1984
42.023
-0.818
-1.91%
jan 1, 1985
41.102
-0.921
-2.19%
jan 1, 1986
40.09
-1.012
-2.46%
jan 1, 1987
39.004
-1.086
-2.71%
jan 1, 1988
37.871
-1.133
-2.9%
jan 1, 1989
36.724
-1.147
-3.03%
jan 1, 1990
35.593
-1.131
-3.08%
jan 1, 1991
34.509
-1.084
-3.05%
jan 1, 1992
33.498
-1.011
-2.93%
jan 1, 1993
32.567
-0.931
-2.78%
jan 1, 1994
31.718
-0.849
-2.61%
jan 1, 1995
30.954
-0.764
-2.41%
jan 1, 1996
30.271
-0.683
-2.21%
jan 1, 1997
29.652
-0.619
-2.04%
jan 1, 1998
29.076
-0.576
-1.94%
jan 1, 1999
28.528
-0.548
-1.88%
jan 1, 2000
28.003
-0.525
-1.84%
jan 1, 2001
27.502
-0.501
-1.79%
jan 1, 2002
27.031
-0.471
-1.71%
jan 1, 2003
26.602
-0.429
-1.59%
jan 1, 2004
26.226
-0.376
-1.41%
jan 1, 2005
25.908
-0.318
-1.21%
jan 1, 2006
25.662
-0.246
-0.95%
jan 1, 2007
25.507
-0.155
-0.6%
jan 1, 2008
25.438
-0.069
-0.27%
jan 1, 2009
25.438
0.0
0.0%
jan 1, 2010
25.482
+0.044
0.17%
jan 1, 2011
25.528
+0.046
0.18%
jan 1, 2012
25.529
+0.001
0.0%
jan 1, 2013
25.45
-0.079
-0.31%
jan 1, 2014
25.267
-0.183
-0.72%
jan 1, 2015
24.972
-0.295
-1.17%
Ranking of countries by current statistics by years


Comments: