29
/
en
AIzaSyAYiBZKx7MnpbEhh9jyipgxe19OcubqV5w
April 1, 2024
130137
Ethiopia
ETH
true
2
1
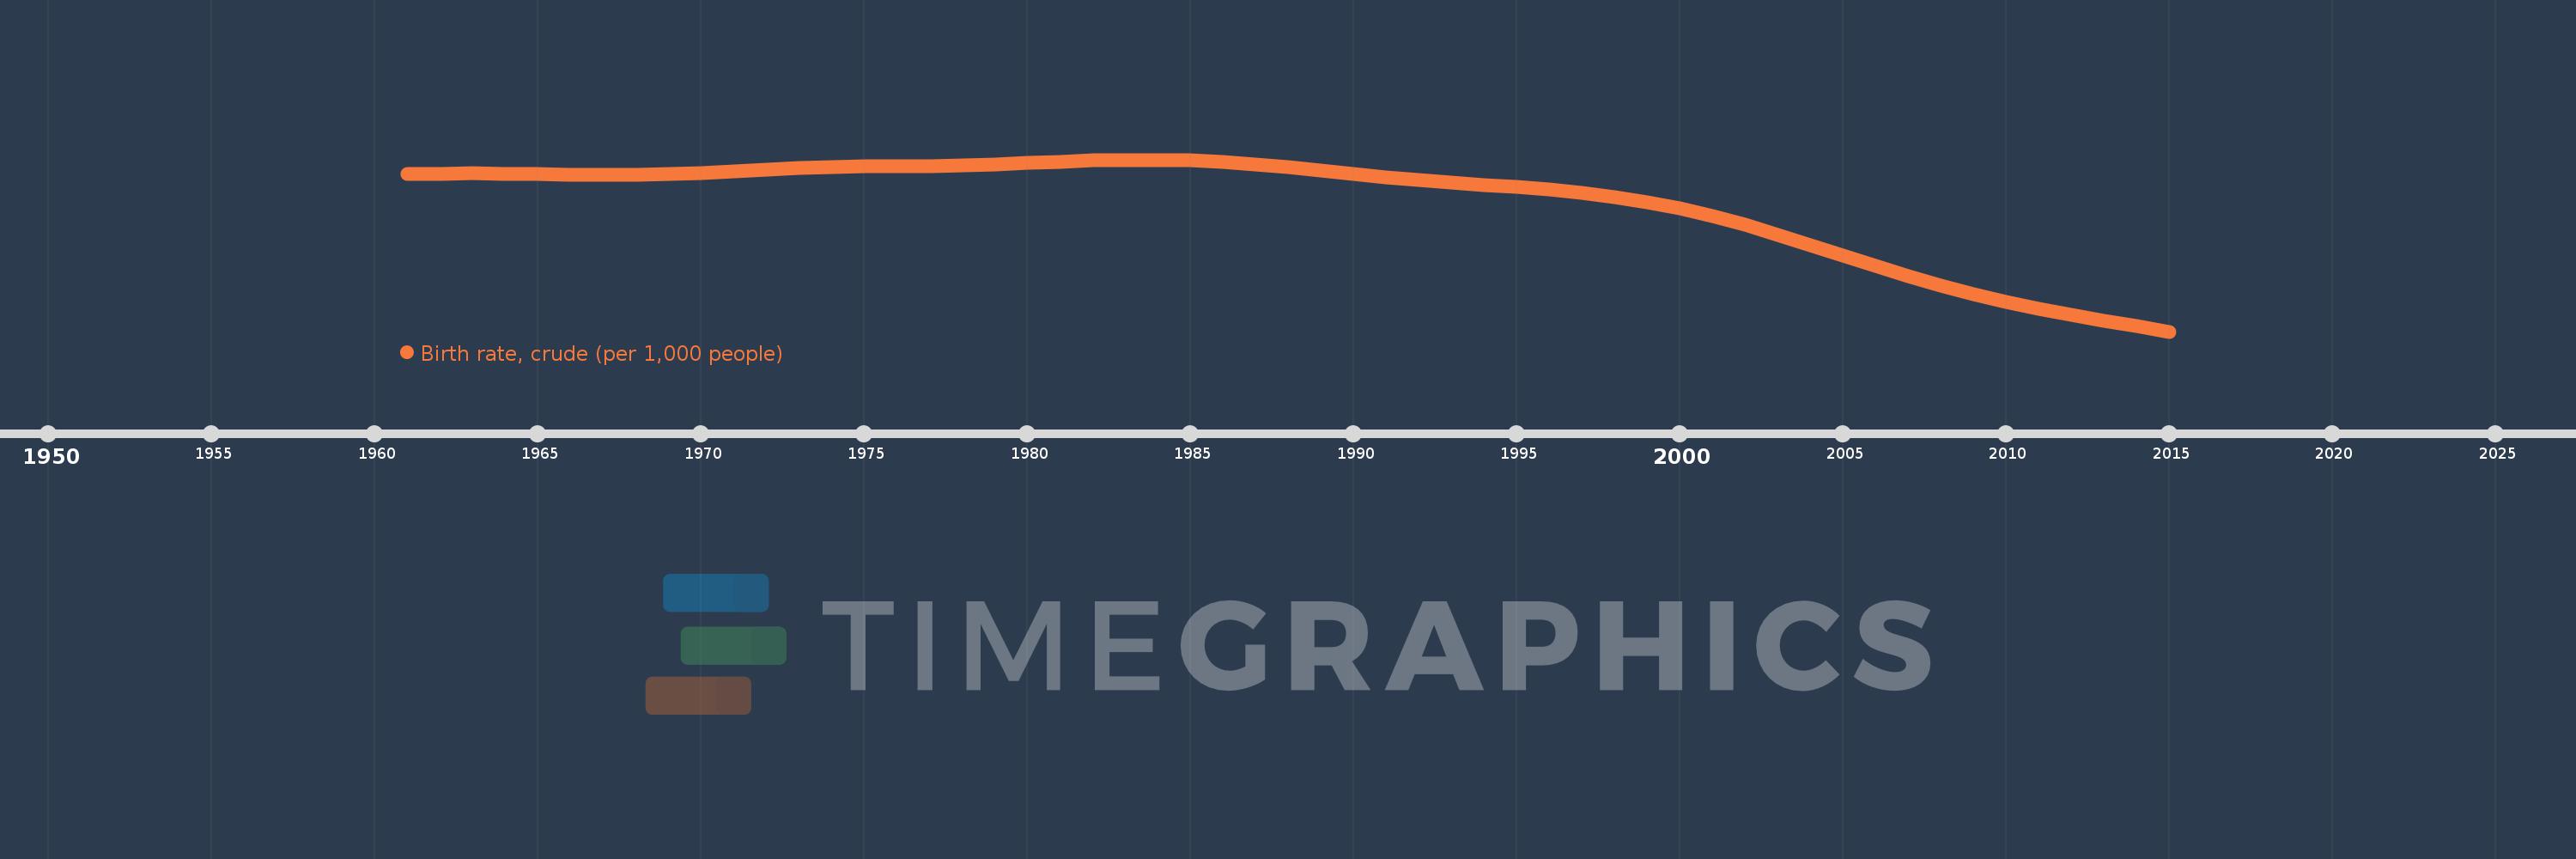
Birth rate, crude (per 1,000 people)
2015,2014,2013,2012,2011,2010,2009,2008,2007,2006,2005,2004,2003,2002,2001,2000,1999,1998,1997,1996,1995,1994,1993,1992,1991,1990,1989,1988,1987,1986,1985,1984,1983,1982,1981,1980,1979,1978,1977,1976,1975,1974,1973,1972,1971,1970,1969,1968,1967,1966,1965,1964,1963,1962,1961
This statistics in other country:
AfghanistanAlbaniaAlgeriaAmerican SamoaAndorraAngolaAntigua and BarbudaArab WorldArgentinaArmeniaArubaAustraliaAustriaAzerbaijanBahamas, TheBahrainBangladeshBarbadosBelarusBelgiumBelizeBeninBermudaBhutanBoliviaBosnia and HerzegovinaBotswanaBrazilBrunei DarussalamBulgariaBurkina FasoBurundiCabo VerdeCambodiaCameroonCanadaCaribbean small statesCayman IslandsCentral African RepublicCentral Europe and the BalticsChadChannel IslandsChileChinaColombiaComorosCongo, Dem. Rep.Congo, Rep.Costa RicaCote d'IvoireCroatiaCubaCuracaoCyprusCzech RepublicDenmarkDjiboutiDominicaDominican RepublicEarly-demographic dividendEast Asia & PacificEast Asia & Pacific (excluding high income)East Asia & Pacific (IDA & IBRD countries)EcuadorEgypt, Arab Rep.El SalvadorEquatorial GuineaEritreaEstoniaEthiopiaEuro areaEurope & Central AsiaEurope & Central Asia (excluding high income)Europe & Central Asia (IDA & IBRD countries)European UnionFaroe IslandsFijiFinlandFragile and conflict affected situationsFranceFrench PolynesiaGabonGambia, TheGeorgiaGermanyGhanaGreeceGreenlandGrenadaGuamGuatemalaGuineaGuinea-BissauGuyanaHaitiHeavily indebted poor countries (HIPC)High incomeHondurasHong Kong SAR, ChinaHungaryIBRD onlyIcelandIDA & IBRD totalIDA blendIDA onlyIDA totalIndiaIndonesiaIran, Islamic Rep.IraqIrelandIsle of ManIsraelItalyJamaicaJapanJordanKazakhstanKenyaKiribatiKorea, Dem. People’s Rep.Korea, Rep.KosovoKuwaitKyrgyz RepublicLao PDRLate-demographic dividendLatin America & Caribbean Latin America & Caribbean (excluding high income)Latin America & the Caribbean (IDA & IBRD countries)LatviaLeast developed countries: UN classificationLebanonLesothoLiberiaLibyaLiechtensteinLithuaniaLow & middle incomeLow incomeLower middle incomeLuxembourgMacao SAR, ChinaMacedonia, FYRMadagascarMalawiMalaysiaMaldivesMaliMaltaMarshall IslandsMauritaniaMauritiusMexicoMicronesia, Fed. Sts.Middle East & North AfricaMiddle East & North Africa (excluding high income)Middle East & North Africa (IDA & IBRD countries)Middle incomeMoldovaMonacoMongoliaMontenegroMoroccoMozambiqueMyanmarNamibiaNepalNetherlandsNew CaledoniaNew ZealandNicaraguaNigerNigeriaNorth AmericaNorwayOECD membersOmanOther small statesPacific island small statesPakistanPalauPanamaPapua New GuineaParaguayPeruPhilippinesPolandPortugalPost-demographic dividendPre-demographic dividendPuerto RicoQatarRomaniaRussian FederationRwandaSamoaSan MarinoSao Tome and PrincipeSaudi ArabiaSenegalSerbiaSeychellesSierra LeoneSingaporeSint Maarten (Dutch part)Slovak RepublicSloveniaSmall statesSolomon IslandsSomaliaSouth AfricaSouth AsiaSouth Asia (IDA & IBRD)South SudanSpainSri LankaSt. Kitts and NevisSt. LuciaSt. Martin (French part)St. Vincent and the GrenadinesSub-Saharan Africa Sub-Saharan Africa (excluding high income)Sub-Saharan Africa (IDA & IBRD countries)SudanSurinameSwazilandSwedenSwitzerlandSyrian Arab RepublicTajikistanTanzaniaThailandTimor-LesteTogoTongaTrinidad and TobagoTunisiaTurkeyTurkmenistanUgandaUkraineUnited Arab EmiratesUnited KingdomUnited StatesUpper middle incomeUruguayUzbekistanVanuatuVenezuela, RBVietnamVirgin Islands (U.S.)West Bank and GazaWorldYemen, Rep.ZambiaZimbabwe Timeline:
This timeline shows a graph from 1961 to 2015 of Ethiopia. No data until 1960. Number of actual observations by date: 55.
Source name:
World Development Indicators
Source organization:
(1) United Nations Population Division. World Population Prospects, (2) Census reports and other statistical publications from national statistical offices, (3) Eurostat: Demographic Statistics, (4) United Nations Statistical Division. Population and Vital Statistics Reprot (various years), (5) U.S. Census Bureau: International Database, and (6) Secretariat of the Pacific Community: Statistics and Demography Programme.
Categories, topics:
Health
Last updated:
apr 23, 2017
Indicators value changes by year
Minimum:
32.412
jan 1, 2015
Maximum:
49.183
jan 1, 1984
At the date of observation
Value
Absolute change
Change from previous value
jan 1, 1961
47.821
+47.821
0.0%
jan 1, 1962
47.837
+0.016
0.03%
jan 1, 1963
47.843
+0.006
0.01%
jan 1, 1964
47.828
-0.015
-0.03%
jan 1, 1965
47.789
-0.039
-0.08%
jan 1, 1966
47.741
-0.048
-0.1%
jan 1, 1967
47.711
-0.03
-0.06%
jan 1, 1968
47.725
+0.014
0.03%
jan 1, 1969
47.794
+0.069
0.14%
jan 1, 1970
47.917
+0.123
0.26%
jan 1, 1971
48.075
+0.158
0.33%
jan 1, 1972
48.239
+0.164
0.34%
jan 1, 1973
48.382
+0.143
0.3%
jan 1, 1974
48.483
+0.101
0.21%
jan 1, 1975
48.541
+0.058
0.12%
jan 1, 1976
48.569
+0.028
0.06%
jan 1, 1977
48.595
+0.026
0.05%
jan 1, 1978
48.645
+0.05
0.1%
jan 1, 1979
48.732
+0.087
0.18%
jan 1, 1980
48.85
+0.118
0.24%
jan 1, 1981
48.983
+0.133
0.27%
jan 1, 1982
49.102
+0.119
0.24%
jan 1, 1983
49.176
+0.074
0.15%
jan 1, 1984
49.183
+0.007
0.01%
jan 1, 1985
49.113
-0.07
-0.14%
jan 1, 1986
48.963
-0.15
-0.31%
jan 1, 1987
48.739
-0.224
-0.46%
jan 1, 1988
48.461
-0.278
-0.57%
jan 1, 1989
48.152
-0.309
-0.64%
jan 1, 1990
47.825
-0.327
-0.68%
jan 1, 1991
47.504
-0.321
-0.67%
jan 1, 1992
47.213
-0.291
-0.61%
jan 1, 1993
46.956
-0.257
-0.54%
jan 1, 1994
46.724
-0.232
-0.49%
jan 1, 1995
46.503
-0.221
-0.47%
jan 1, 1996
46.263
-0.24
-0.52%
jan 1, 1997
45.966
-0.297
-0.64%
jan 1, 1998
45.577
-0.389
-0.85%
jan 1, 1999
45.072
-0.505
-1.11%
jan 1, 2000
44.445
-0.627
-1.39%
jan 1, 2001
43.69
-0.755
-1.7%
jan 1, 2002
42.814
-0.876
-2.01%
jan 1, 2003
41.851
-0.963
-2.25%
jan 1, 2004
40.838
-1.013
-2.42%
jan 1, 2005
39.805
-1.033
-2.53%
jan 1, 2006
38.788
-1.017
-2.55%
jan 1, 2007
37.815
-0.973
-2.51%
jan 1, 2008
36.903
-0.912
-2.41%
jan 1, 2009
36.062
-0.841
-2.28%
jan 1, 2010
35.301
-0.761
-2.11%
jan 1, 2011
34.622
-0.679
-1.92%
jan 1, 2012
34.014
-0.608
-1.76%
jan 1, 2013
33.456
-0.558
-1.64%
jan 1, 2014
32.925
-0.531
-1.59%
jan 1, 2015
32.412
-0.513
-1.56%
Ranking of countries by current statistics by years


Comments: