29
/
en
AIzaSyAYiBZKx7MnpbEhh9jyipgxe19OcubqV5w
April 1, 2024
266582
Trinidad and Tobago
TTO
true
2
1
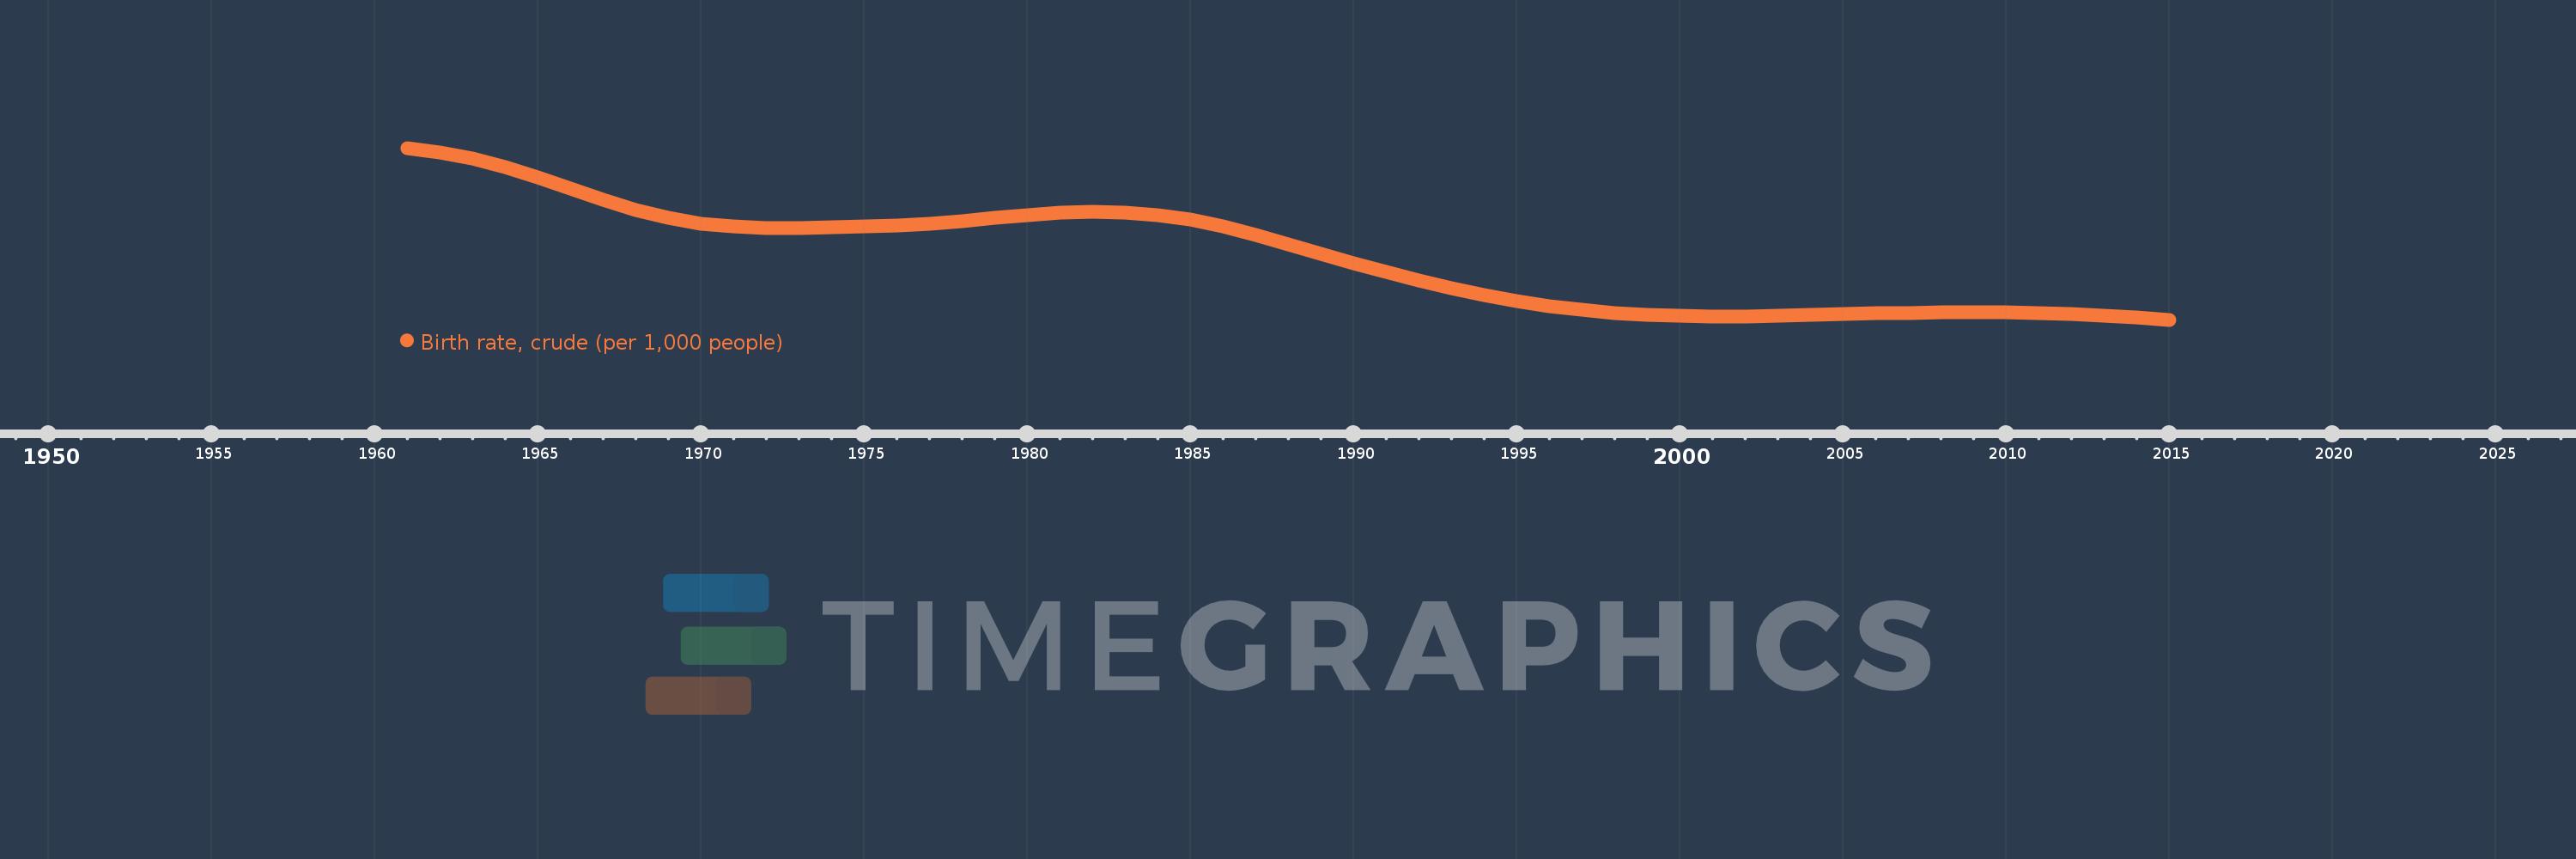
Birth rate, crude (per 1,000 people)
2015,2014,2013,2012,2011,2010,2009,2008,2007,2006,2005,2004,2003,2002,2001,2000,1999,1998,1997,1996,1995,1994,1993,1992,1991,1990,1989,1988,1987,1986,1985,1984,1983,1982,1981,1980,1979,1978,1977,1976,1975,1974,1973,1972,1971,1970,1969,1968,1967,1966,1965,1964,1963,1962,1961
This statistics in other country:
AfghanistanAlbaniaAlgeriaAmerican SamoaAndorraAngolaAntigua and BarbudaArab WorldArgentinaArmeniaArubaAustraliaAustriaAzerbaijanBahamas, TheBahrainBangladeshBarbadosBelarusBelgiumBelizeBeninBermudaBhutanBoliviaBosnia and HerzegovinaBotswanaBrazilBrunei DarussalamBulgariaBurkina FasoBurundiCabo VerdeCambodiaCameroonCanadaCaribbean small statesCayman IslandsCentral African RepublicCentral Europe and the BalticsChadChannel IslandsChileChinaColombiaComorosCongo, Dem. Rep.Congo, Rep.Costa RicaCote d'IvoireCroatiaCubaCuracaoCyprusCzech RepublicDenmarkDjiboutiDominicaDominican RepublicEarly-demographic dividendEast Asia & PacificEast Asia & Pacific (excluding high income)East Asia & Pacific (IDA & IBRD countries)EcuadorEgypt, Arab Rep.El SalvadorEquatorial GuineaEritreaEstoniaEthiopiaEuro areaEurope & Central AsiaEurope & Central Asia (excluding high income)Europe & Central Asia (IDA & IBRD countries)European UnionFaroe IslandsFijiFinlandFragile and conflict affected situationsFranceFrench PolynesiaGabonGambia, TheGeorgiaGermanyGhanaGreeceGreenlandGrenadaGuamGuatemalaGuineaGuinea-BissauGuyanaHaitiHeavily indebted poor countries (HIPC)High incomeHondurasHong Kong SAR, ChinaHungaryIBRD onlyIcelandIDA & IBRD totalIDA blendIDA onlyIDA totalIndiaIndonesiaIran, Islamic Rep.IraqIrelandIsle of ManIsraelItalyJamaicaJapanJordanKazakhstanKenyaKiribatiKorea, Dem. People’s Rep.Korea, Rep.KosovoKuwaitKyrgyz RepublicLao PDRLate-demographic dividendLatin America & Caribbean Latin America & Caribbean (excluding high income)Latin America & the Caribbean (IDA & IBRD countries)LatviaLeast developed countries: UN classificationLebanonLesothoLiberiaLibyaLiechtensteinLithuaniaLow & middle incomeLow incomeLower middle incomeLuxembourgMacao SAR, ChinaMacedonia, FYRMadagascarMalawiMalaysiaMaldivesMaliMaltaMarshall IslandsMauritaniaMauritiusMexicoMicronesia, Fed. Sts.Middle East & North AfricaMiddle East & North Africa (excluding high income)Middle East & North Africa (IDA & IBRD countries)Middle incomeMoldovaMonacoMongoliaMontenegroMoroccoMozambiqueMyanmarNamibiaNepalNetherlandsNew CaledoniaNew ZealandNicaraguaNigerNigeriaNorth AmericaNorwayOECD membersOmanOther small statesPacific island small statesPakistanPalauPanamaPapua New GuineaParaguayPeruPhilippinesPolandPortugalPost-demographic dividendPre-demographic dividendPuerto RicoQatarRomaniaRussian FederationRwandaSamoaSan MarinoSao Tome and PrincipeSaudi ArabiaSenegalSerbiaSeychellesSierra LeoneSingaporeSint Maarten (Dutch part)Slovak RepublicSloveniaSmall statesSolomon IslandsSomaliaSouth AfricaSouth AsiaSouth Asia (IDA & IBRD)South SudanSpainSri LankaSt. Kitts and NevisSt. LuciaSt. Martin (French part)St. Vincent and the GrenadinesSub-Saharan Africa Sub-Saharan Africa (excluding high income)Sub-Saharan Africa (IDA & IBRD countries)SudanSurinameSwazilandSwedenSwitzerlandSyrian Arab RepublicTajikistanTanzaniaThailandTimor-LesteTogoTongaTrinidad and TobagoTunisiaTurkeyTurkmenistanUgandaUkraineUnited Arab EmiratesUnited KingdomUnited StatesUpper middle incomeUruguayUzbekistanVanuatuVenezuela, RBVietnamVirgin Islands (U.S.)West Bank and GazaWorldYemen, Rep.ZambiaZimbabwe Timeline:
This timeline shows a graph from 1961 to 2015 of Trinidad and Tobago. No data until 1960. Number of actual observations by date: 55.
Source name:
World Development Indicators
Source organization:
(1) United Nations Population Division. World Population Prospects, (2) Census reports and other statistical publications from national statistical offices, (3) Eurostat: Demographic Statistics, (4) United Nations Statistical Division. Population and Vital Statistics Reprot (various years), (5) U.S. Census Bureau: International Database, and (6) Secretariat of the Pacific Community: Statistics and Demography Programme.
Categories, topics:
Health
Last updated:
apr 23, 2017
Indicators value changes by year
Maximum:
37.333
jan 1, 1961
At the date of observation
Value
Absolute change
Change from previous value
jan 1, 1961
37.333
+37.333
0.0%
jan 1, 1962
36.733
-0.6
-1.61%
jan 1, 1963
35.869
-0.864
-2.35%
jan 1, 1964
34.731
-1.138
-3.17%
jan 1, 1965
33.361
-1.37
-3.94%
jan 1, 1966
31.862
-1.499
-4.49%
jan 1, 1967
30.376
-1.486
-4.66%
jan 1, 1968
29.043
-1.333
-4.39%
jan 1, 1969
27.973
-1.07
-3.68%
jan 1, 1970
27.215
-0.758
-2.71%
jan 1, 1971
26.774
-0.441
-1.62%
jan 1, 1972
26.607
-0.167
-0.62%
jan 1, 1973
26.611
+0.004
0.02%
jan 1, 1974
26.695
+0.084
0.32%
jan 1, 1975
26.821
+0.126
0.47%
jan 1, 1976
26.988
+0.167
0.62%
jan 1, 1977
27.221
+0.233
0.86%
jan 1, 1978
27.535
+0.314
1.15%
jan 1, 1979
27.914
+0.379
1.38%
jan 1, 1980
28.306
+0.392
1.4%
jan 1, 1981
28.625
+0.319
1.13%
jan 1, 1982
28.774
+0.149
0.52%
jan 1, 1983
28.689
-0.085
-0.3%
jan 1, 1984
28.334
-0.355
-1.24%
jan 1, 1985
27.701
-0.633
-2.23%
jan 1, 1986
26.805
-0.896
-3.23%
jan 1, 1987
25.691
-1.114
-4.16%
jan 1, 1988
24.449
-1.242
-4.83%
jan 1, 1989
23.167
-1.282
-5.24%
jan 1, 1990
21.905
-1.262
-5.45%
jan 1, 1991
20.707
-1.198
-5.47%
jan 1, 1992
19.6
-1.107
-5.35%
jan 1, 1993
18.581
-1.019
-5.2%
jan 1, 1994
17.655
-0.926
-4.98%
jan 1, 1995
16.841
-0.814
-4.61%
jan 1, 1996
16.16
-0.681
-4.04%
jan 1, 1997
15.625
-0.535
-3.31%
jan 1, 1998
15.227
-0.398
-2.55%
jan 1, 1999
14.951
-0.276
-1.81%
jan 1, 2000
14.784
-0.167
-1.12%
jan 1, 2001
14.715
-0.069
-0.47%
jan 1, 2002
14.731
+0.016
0.11%
jan 1, 2003
14.808
+0.077
0.52%
jan 1, 2004
14.92
+0.112
0.76%
jan 1, 2005
15.044
+0.124
0.83%
jan 1, 2006
15.157
+0.113
0.75%
jan 1, 2007
15.244
+0.087
0.57%
jan 1, 2008
15.299
+0.055
0.36%
jan 1, 2009
15.317
+0.018
0.12%
jan 1, 2010
15.286
-0.031
-0.2%
jan 1, 2011
15.199
-0.087
-0.57%
jan 1, 2012
15.048
-0.151
-0.99%
jan 1, 2013
14.842
-0.206
-1.37%
jan 1, 2014
14.59
-0.252
-1.7%
jan 1, 2015
14.3
-0.29
-1.99%
Ranking of countries by current statistics by years


Comments: