29
/
en
AIzaSyAYiBZKx7MnpbEhh9jyipgxe19OcubqV5w
April 1, 2024
92389
Brunei Darussalam
BRN
true
2
1
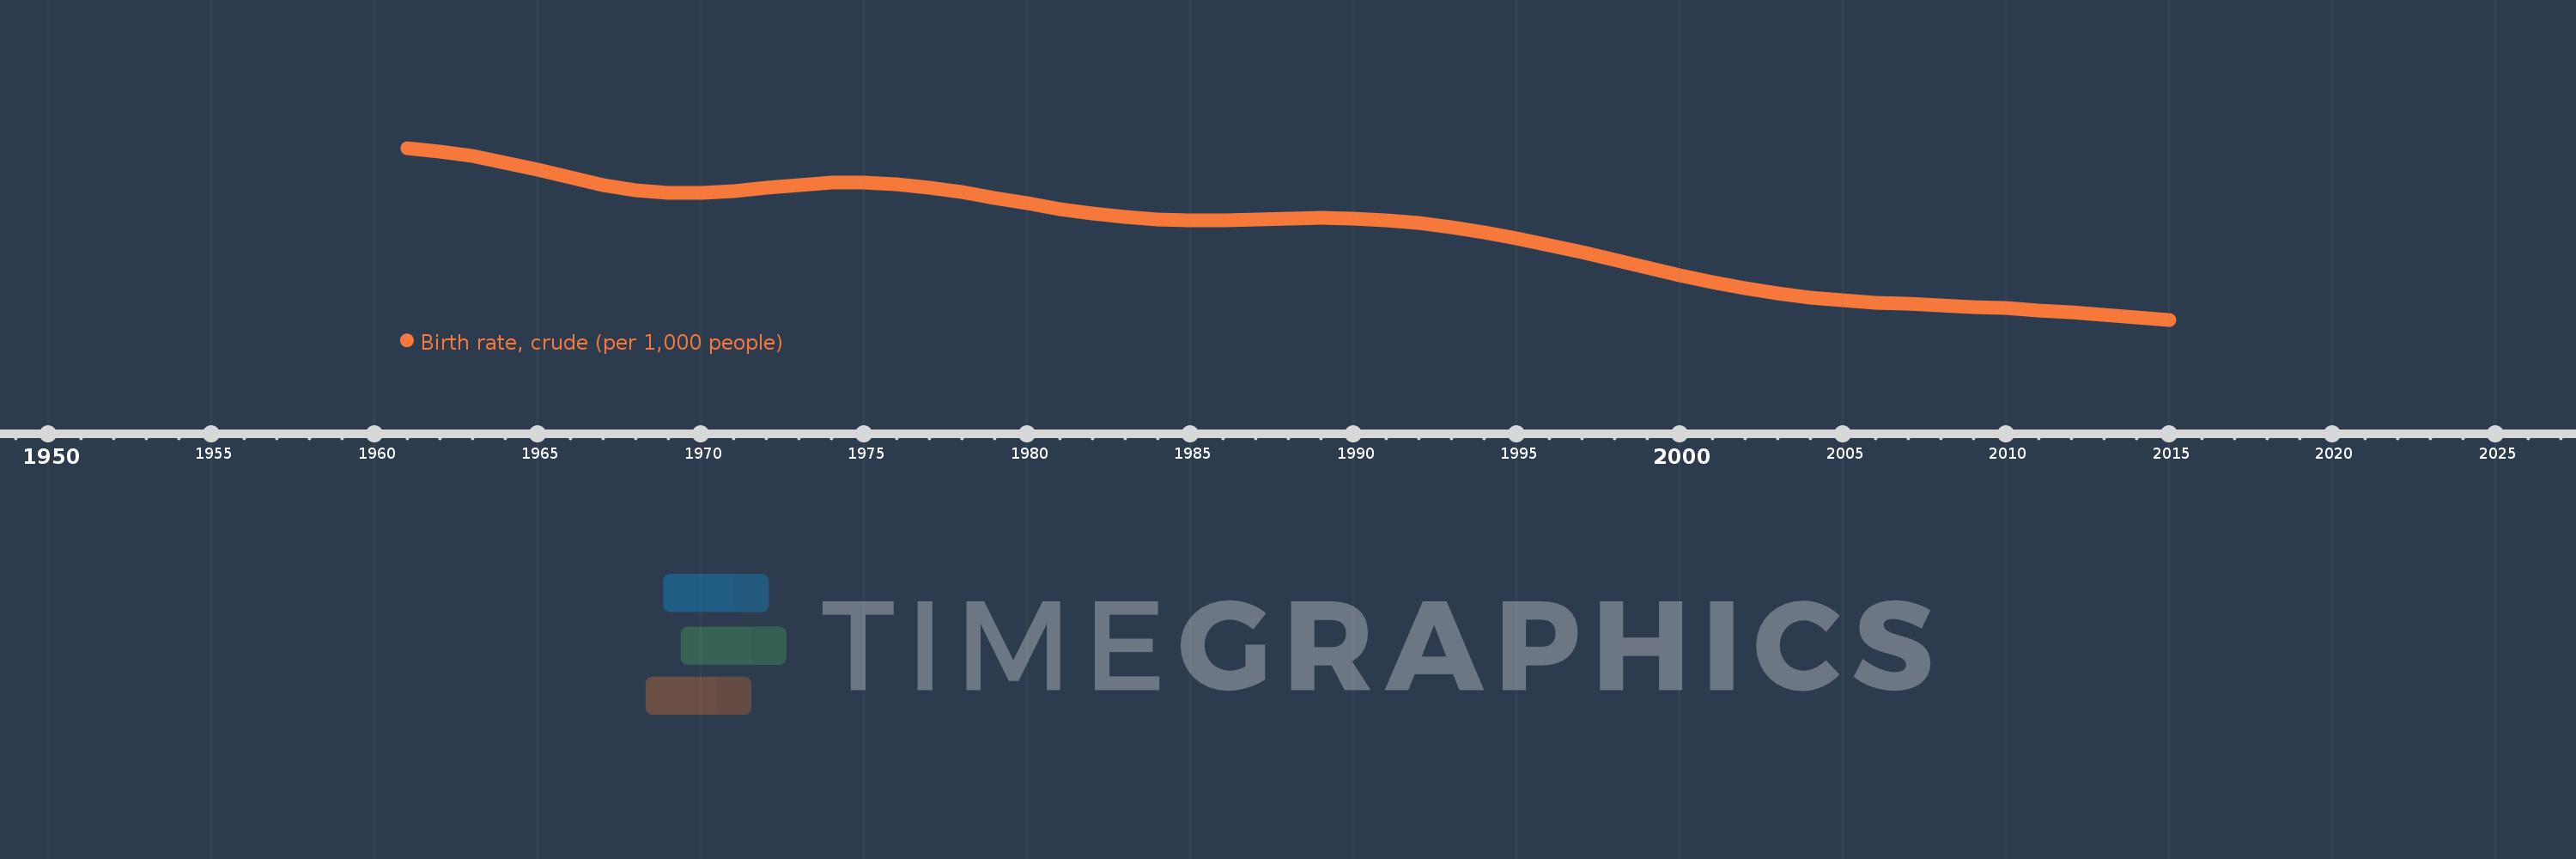
Birth rate, crude (per 1,000 people)
2015,2014,2013,2012,2011,2010,2009,2008,2007,2006,2005,2004,2003,2002,2001,2000,1999,1998,1997,1996,1995,1994,1993,1992,1991,1990,1989,1988,1987,1986,1985,1984,1983,1982,1981,1980,1979,1978,1977,1976,1975,1974,1973,1972,1971,1970,1969,1968,1967,1966,1965,1964,1963,1962,1961
This statistics in other country:
AfghanistanAlbaniaAlgeriaAmerican SamoaAndorraAngolaAntigua and BarbudaArab WorldArgentinaArmeniaArubaAustraliaAustriaAzerbaijanBahamas, TheBahrainBangladeshBarbadosBelarusBelgiumBelizeBeninBermudaBhutanBoliviaBosnia and HerzegovinaBotswanaBrazilBrunei DarussalamBulgariaBurkina FasoBurundiCabo VerdeCambodiaCameroonCanadaCaribbean small statesCayman IslandsCentral African RepublicCentral Europe and the BalticsChadChannel IslandsChileChinaColombiaComorosCongo, Dem. Rep.Congo, Rep.Costa RicaCote d'IvoireCroatiaCubaCuracaoCyprusCzech RepublicDenmarkDjiboutiDominicaDominican RepublicEarly-demographic dividendEast Asia & PacificEast Asia & Pacific (excluding high income)East Asia & Pacific (IDA & IBRD countries)EcuadorEgypt, Arab Rep.El SalvadorEquatorial GuineaEritreaEstoniaEthiopiaEuro areaEurope & Central AsiaEurope & Central Asia (excluding high income)Europe & Central Asia (IDA & IBRD countries)European UnionFaroe IslandsFijiFinlandFragile and conflict affected situationsFranceFrench PolynesiaGabonGambia, TheGeorgiaGermanyGhanaGreeceGreenlandGrenadaGuamGuatemalaGuineaGuinea-BissauGuyanaHaitiHeavily indebted poor countries (HIPC)High incomeHondurasHong Kong SAR, ChinaHungaryIBRD onlyIcelandIDA & IBRD totalIDA blendIDA onlyIDA totalIndiaIndonesiaIran, Islamic Rep.IraqIrelandIsle of ManIsraelItalyJamaicaJapanJordanKazakhstanKenyaKiribatiKorea, Dem. People’s Rep.Korea, Rep.KosovoKuwaitKyrgyz RepublicLao PDRLate-demographic dividendLatin America & Caribbean Latin America & Caribbean (excluding high income)Latin America & the Caribbean (IDA & IBRD countries)LatviaLeast developed countries: UN classificationLebanonLesothoLiberiaLibyaLiechtensteinLithuaniaLow & middle incomeLow incomeLower middle incomeLuxembourgMacao SAR, ChinaMacedonia, FYRMadagascarMalawiMalaysiaMaldivesMaliMaltaMarshall IslandsMauritaniaMauritiusMexicoMicronesia, Fed. Sts.Middle East & North AfricaMiddle East & North Africa (excluding high income)Middle East & North Africa (IDA & IBRD countries)Middle incomeMoldovaMonacoMongoliaMontenegroMoroccoMozambiqueMyanmarNamibiaNepalNetherlandsNew CaledoniaNew ZealandNicaraguaNigerNigeriaNorth AmericaNorwayOECD membersOmanOther small statesPacific island small statesPakistanPalauPanamaPapua New GuineaParaguayPeruPhilippinesPolandPortugalPost-demographic dividendPre-demographic dividendPuerto RicoQatarRomaniaRussian FederationRwandaSamoaSan MarinoSao Tome and PrincipeSaudi ArabiaSenegalSerbiaSeychellesSierra LeoneSingaporeSint Maarten (Dutch part)Slovak RepublicSloveniaSmall statesSolomon IslandsSomaliaSouth AfricaSouth AsiaSouth Asia (IDA & IBRD)South SudanSpainSri LankaSt. Kitts and NevisSt. LuciaSt. Martin (French part)St. Vincent and the GrenadinesSub-Saharan Africa Sub-Saharan Africa (excluding high income)Sub-Saharan Africa (IDA & IBRD countries)SudanSurinameSwazilandSwedenSwitzerlandSyrian Arab RepublicTajikistanTanzaniaThailandTimor-LesteTogoTongaTrinidad and TobagoTunisiaTurkeyTurkmenistanUgandaUkraineUnited Arab EmiratesUnited KingdomUnited StatesUpper middle incomeUruguayUzbekistanVanuatuVenezuela, RBVietnamVirgin Islands (U.S.)West Bank and GazaWorldYemen, Rep.ZambiaZimbabwe Timeline:
This timeline shows a graph from 1961 to 2015 of Brunei Darussalam. No data until 1960. Number of actual observations by date: 55.
Source name:
World Development Indicators
Source organization:
(1) United Nations Population Division. World Population Prospects, (2) Census reports and other statistical publications from national statistical offices, (3) Eurostat: Demographic Statistics, (4) United Nations Statistical Division. Population and Vital Statistics Reprot (various years), (5) U.S. Census Bureau: International Database, and (6) Secretariat of the Pacific Community: Statistics and Demography Programme.
Categories, topics:
Health
Last updated:
apr 23, 2017
Indicators value changes by year
Minimum:
16.043
jan 1, 2015
Maximum:
42.779
jan 1, 1961
At the date of observation
Value
Absolute change
Change from previous value
jan 1, 1961
42.779
+42.779
0.0%
jan 1, 1962
42.23
-0.549
-1.28%
jan 1, 1963
41.49
-0.74
-1.75%
jan 1, 1964
40.525
-0.965
-2.33%
jan 1, 1965
39.365
-1.16
-2.86%
jan 1, 1966
38.142
-1.223
-3.11%
jan 1, 1967
37.045
-1.097
-2.88%
jan 1, 1968
36.243
-0.802
-2.16%
jan 1, 1969
35.83
-0.413
-1.14%
jan 1, 1970
35.809
-0.021
-0.06%
jan 1, 1971
36.105
+0.296
0.83%
jan 1, 1972
36.578
+0.473
1.31%
jan 1, 1973
37.039
+0.461
1.26%
jan 1, 1974
37.332
+0.293
0.79%
jan 1, 1975
37.386
+0.054
0.14%
jan 1, 1976
37.15
-0.236
-0.63%
jan 1, 1977
36.618
-0.532
-1.43%
jan 1, 1978
35.88
-0.738
-2.02%
jan 1, 1979
35.032
-0.848
-2.36%
jan 1, 1980
34.137
-0.895
-2.55%
jan 1, 1981
33.282
-0.855
-2.5%
jan 1, 1982
32.563
-0.719
-2.16%
jan 1, 1983
32.023
-0.54
-1.66%
jan 1, 1984
31.682
-0.341
-1.06%
jan 1, 1985
31.536
-0.146
-0.46%
jan 1, 1986
31.553
+0.017
0.05%
jan 1, 1987
31.673
+0.12
0.38%
jan 1, 1988
31.801
+0.128
0.4%
jan 1, 1989
31.853
+0.052
0.16%
jan 1, 1990
31.774
-0.079
-0.25%
jan 1, 1991
31.519
-0.255
-0.8%
jan 1, 1992
31.06
-0.459
-1.46%
jan 1, 1993
30.421
-0.639
-2.06%
jan 1, 1994
29.63
-0.791
-2.6%
jan 1, 1995
28.707
-0.923
-3.12%
jan 1, 1996
27.666
-1.041
-3.63%
jan 1, 1997
26.526
-1.14
-4.12%
jan 1, 1998
25.326
-1.2
-4.52%
jan 1, 1999
24.114
-1.212
-4.79%
jan 1, 2000
22.936
-1.178
-4.89%
jan 1, 2001
21.852
-1.084
-4.73%
jan 1, 2002
20.913
-0.939
-4.3%
jan 1, 2003
20.137
-0.776
-3.71%
jan 1, 2004
19.522
-0.615
-3.05%
jan 1, 2005
19.065
-0.457
-2.34%
jan 1, 2006
18.738
-0.327
-1.72%
jan 1, 2007
18.499
-0.239
-1.28%
jan 1, 2008
18.292
-0.207
-1.12%
jan 1, 2009
18.07
-0.222
-1.21%
jan 1, 2010
17.809
-0.261
-1.44%
jan 1, 2011
17.499
-0.31
-1.74%
jan 1, 2012
17.146
-0.353
-2.02%
jan 1, 2013
16.774
-0.372
-2.17%
jan 1, 2014
16.405
-0.369
-2.2%
jan 1, 2015
16.043
-0.362
-2.21%
Ranking of countries by current statistics by years


Comments: