29
/
en
AIzaSyAYiBZKx7MnpbEhh9jyipgxe19OcubqV5w
April 1, 2024
146593
Guinea-Bissau
GNB
true
2
1
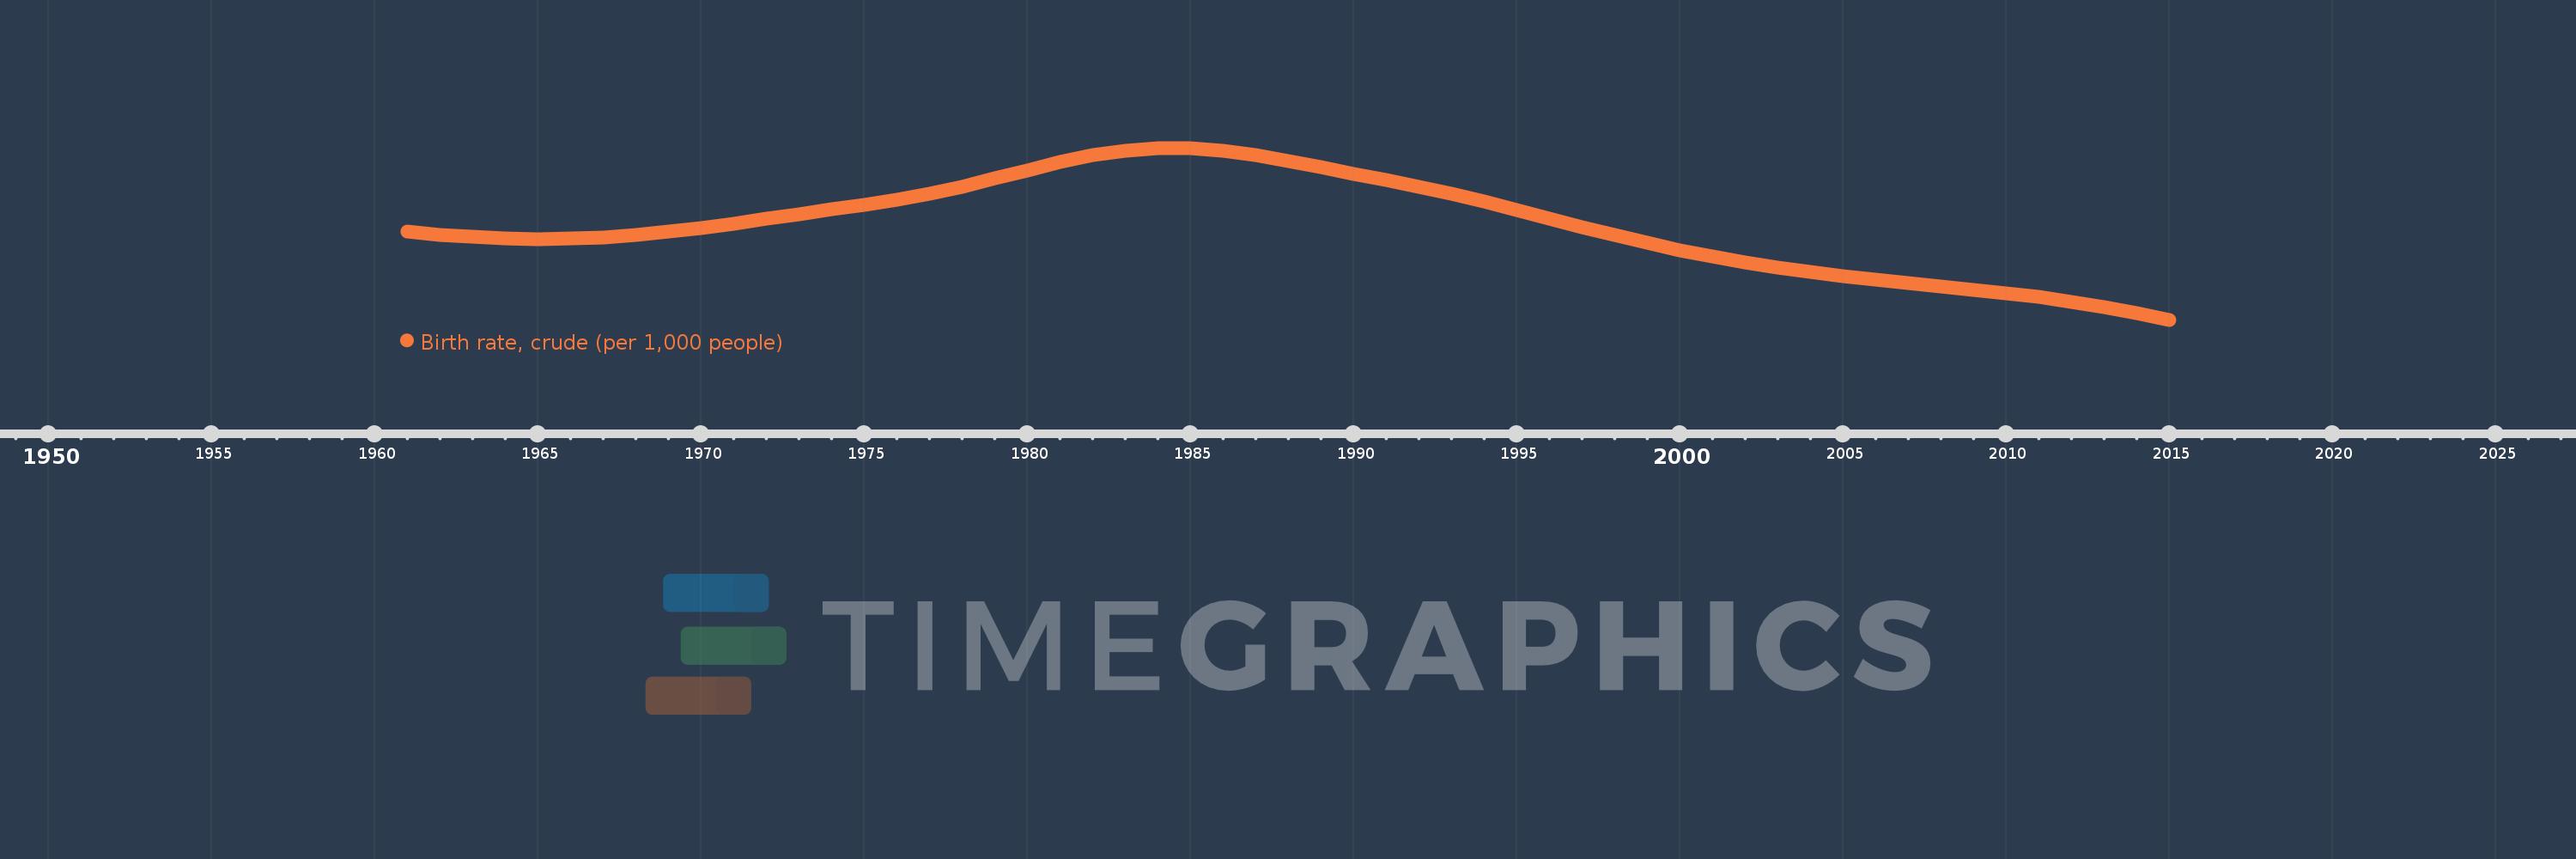
Birth rate, crude (per 1,000 people)
2015,2014,2013,2012,2011,2010,2009,2008,2007,2006,2005,2004,2003,2002,2001,2000,1999,1998,1997,1996,1995,1994,1993,1992,1991,1990,1989,1988,1987,1986,1985,1984,1983,1982,1981,1980,1979,1978,1977,1976,1975,1974,1973,1972,1971,1970,1969,1968,1967,1966,1965,1964,1963,1962,1961
This statistics in other country:
AfghanistanAlbaniaAlgeriaAmerican SamoaAndorraAngolaAntigua and BarbudaArab WorldArgentinaArmeniaArubaAustraliaAustriaAzerbaijanBahamas, TheBahrainBangladeshBarbadosBelarusBelgiumBelizeBeninBermudaBhutanBoliviaBosnia and HerzegovinaBotswanaBrazilBrunei DarussalamBulgariaBurkina FasoBurundiCabo VerdeCambodiaCameroonCanadaCaribbean small statesCayman IslandsCentral African RepublicCentral Europe and the BalticsChadChannel IslandsChileChinaColombiaComorosCongo, Dem. Rep.Congo, Rep.Costa RicaCote d'IvoireCroatiaCubaCuracaoCyprusCzech RepublicDenmarkDjiboutiDominicaDominican RepublicEarly-demographic dividendEast Asia & PacificEast Asia & Pacific (excluding high income)East Asia & Pacific (IDA & IBRD countries)EcuadorEgypt, Arab Rep.El SalvadorEquatorial GuineaEritreaEstoniaEthiopiaEuro areaEurope & Central AsiaEurope & Central Asia (excluding high income)Europe & Central Asia (IDA & IBRD countries)European UnionFaroe IslandsFijiFinlandFragile and conflict affected situationsFranceFrench PolynesiaGabonGambia, TheGeorgiaGermanyGhanaGreeceGreenlandGrenadaGuamGuatemalaGuineaGuinea-BissauGuyanaHaitiHeavily indebted poor countries (HIPC)High incomeHondurasHong Kong SAR, ChinaHungaryIBRD onlyIcelandIDA & IBRD totalIDA blendIDA onlyIDA totalIndiaIndonesiaIran, Islamic Rep.IraqIrelandIsle of ManIsraelItalyJamaicaJapanJordanKazakhstanKenyaKiribatiKorea, Dem. People’s Rep.Korea, Rep.KosovoKuwaitKyrgyz RepublicLao PDRLate-demographic dividendLatin America & Caribbean Latin America & Caribbean (excluding high income)Latin America & the Caribbean (IDA & IBRD countries)LatviaLeast developed countries: UN classificationLebanonLesothoLiberiaLibyaLiechtensteinLithuaniaLow & middle incomeLow incomeLower middle incomeLuxembourgMacao SAR, ChinaMacedonia, FYRMadagascarMalawiMalaysiaMaldivesMaliMaltaMarshall IslandsMauritaniaMauritiusMexicoMicronesia, Fed. Sts.Middle East & North AfricaMiddle East & North Africa (excluding high income)Middle East & North Africa (IDA & IBRD countries)Middle incomeMoldovaMonacoMongoliaMontenegroMoroccoMozambiqueMyanmarNamibiaNepalNetherlandsNew CaledoniaNew ZealandNicaraguaNigerNigeriaNorth AmericaNorwayOECD membersOmanOther small statesPacific island small statesPakistanPalauPanamaPapua New GuineaParaguayPeruPhilippinesPolandPortugalPost-demographic dividendPre-demographic dividendPuerto RicoQatarRomaniaRussian FederationRwandaSamoaSan MarinoSao Tome and PrincipeSaudi ArabiaSenegalSerbiaSeychellesSierra LeoneSingaporeSint Maarten (Dutch part)Slovak RepublicSloveniaSmall statesSolomon IslandsSomaliaSouth AfricaSouth AsiaSouth Asia (IDA & IBRD)South SudanSpainSri LankaSt. Kitts and NevisSt. LuciaSt. Martin (French part)St. Vincent and the GrenadinesSub-Saharan Africa Sub-Saharan Africa (excluding high income)Sub-Saharan Africa (IDA & IBRD countries)SudanSurinameSwazilandSwedenSwitzerlandSyrian Arab RepublicTajikistanTanzaniaThailandTimor-LesteTogoTongaTrinidad and TobagoTunisiaTurkeyTurkmenistanUgandaUkraineUnited Arab EmiratesUnited KingdomUnited StatesUpper middle incomeUruguayUzbekistanVanuatuVenezuela, RBVietnamVirgin Islands (U.S.)West Bank and GazaWorldYemen, Rep.ZambiaZimbabwe Timeline:
This timeline shows a graph from 1961 to 2015 of Guinea-Bissau. No data until 1960. Number of actual observations by date: 55.
Source name:
World Development Indicators
Source organization:
(1) United Nations Population Division. World Population Prospects, (2) Census reports and other statistical publications from national statistical offices, (3) Eurostat: Demographic Statistics, (4) United Nations Statistical Division. Population and Vital Statistics Reprot (various years), (5) U.S. Census Bureau: International Database, and (6) Secretariat of the Pacific Community: Statistics and Demography Programme.
Categories, topics:
Health
Last updated:
apr 23, 2017
Indicators value changes by year
Minimum:
37.097
jan 1, 2015
Maximum:
47.359
jan 1, 1984
At the date of observation
Value
Absolute change
Change from previous value
jan 1, 1961
42.369
+42.369
0.0%
jan 1, 1962
42.173
-0.196
-0.46%
jan 1, 1963
42.036
-0.137
-0.32%
jan 1, 1964
41.955
-0.081
-0.19%
jan 1, 1965
41.925
-0.03
-0.07%
jan 1, 1966
41.948
+0.023
0.05%
jan 1, 1967
42.028
+0.08
0.19%
jan 1, 1968
42.163
+0.135
0.32%
jan 1, 1969
42.35
+0.187
0.44%
jan 1, 1970
42.581
+0.231
0.55%
jan 1, 1971
42.842
+0.261
0.61%
jan 1, 1972
43.119
+0.277
0.65%
jan 1, 1973
43.404
+0.285
0.66%
jan 1, 1974
43.691
+0.287
0.66%
jan 1, 1975
43.979
+0.288
0.66%
jan 1, 1976
44.286
+0.307
0.7%
jan 1, 1977
44.642
+0.356
0.8%
jan 1, 1978
45.058
+0.416
0.93%
jan 1, 1979
45.527
+0.469
1.04%
jan 1, 1980
46.026
+0.499
1.1%
jan 1, 1981
46.509
+0.483
1.05%
jan 1, 1982
46.92
+0.411
0.88%
jan 1, 1983
47.213
+0.293
0.62%
jan 1, 1984
47.359
+0.146
0.31%
jan 1, 1985
47.347
-0.012
-0.03%
jan 1, 1986
47.188
-0.159
-0.34%
jan 1, 1987
46.912
-0.276
-0.58%
jan 1, 1988
46.567
-0.345
-0.74%
jan 1, 1989
46.195
-0.372
-0.8%
jan 1, 1990
45.814
-0.381
-0.82%
jan 1, 1991
45.429
-0.385
-0.84%
jan 1, 1992
45.032
-0.397
-0.87%
jan 1, 1993
44.606
-0.426
-0.95%
jan 1, 1994
44.146
-0.46
-1.03%
jan 1, 1995
43.657
-0.489
-1.11%
jan 1, 1996
43.153
-0.504
-1.15%
jan 1, 1997
42.648
-0.505
-1.17%
jan 1, 1998
42.156
-0.492
-1.15%
jan 1, 1999
41.691
-0.465
-1.1%
jan 1, 2000
41.262
-0.429
-1.03%
jan 1, 2001
40.876
-0.386
-0.94%
jan 1, 2002
40.536
-0.34
-0.83%
jan 1, 2003
40.234
-0.302
-0.75%
jan 1, 2004
39.962
-0.272
-0.68%
jan 1, 2005
39.713
-0.249
-0.62%
jan 1, 2006
39.485
-0.228
-0.57%
jan 1, 2007
39.276
-0.209
-0.53%
jan 1, 2008
39.078
-0.198
-0.5%
jan 1, 2009
38.881
-0.197
-0.5%
jan 1, 2010
38.675
-0.206
-0.53%
jan 1, 2011
38.444
-0.231
-0.6%
jan 1, 2012
38.175
-0.269
-0.7%
jan 1, 2013
37.863
-0.312
-0.82%
jan 1, 2014
37.503
-0.36
-0.95%
jan 1, 2015
37.097
-0.406
-1.08%
Ranking of countries by current statistics by years


Comments: