29
/
en
AIzaSyAYiBZKx7MnpbEhh9jyipgxe19OcubqV5w
April 1, 2024
171471
Kuwait
KWT
true
2
1
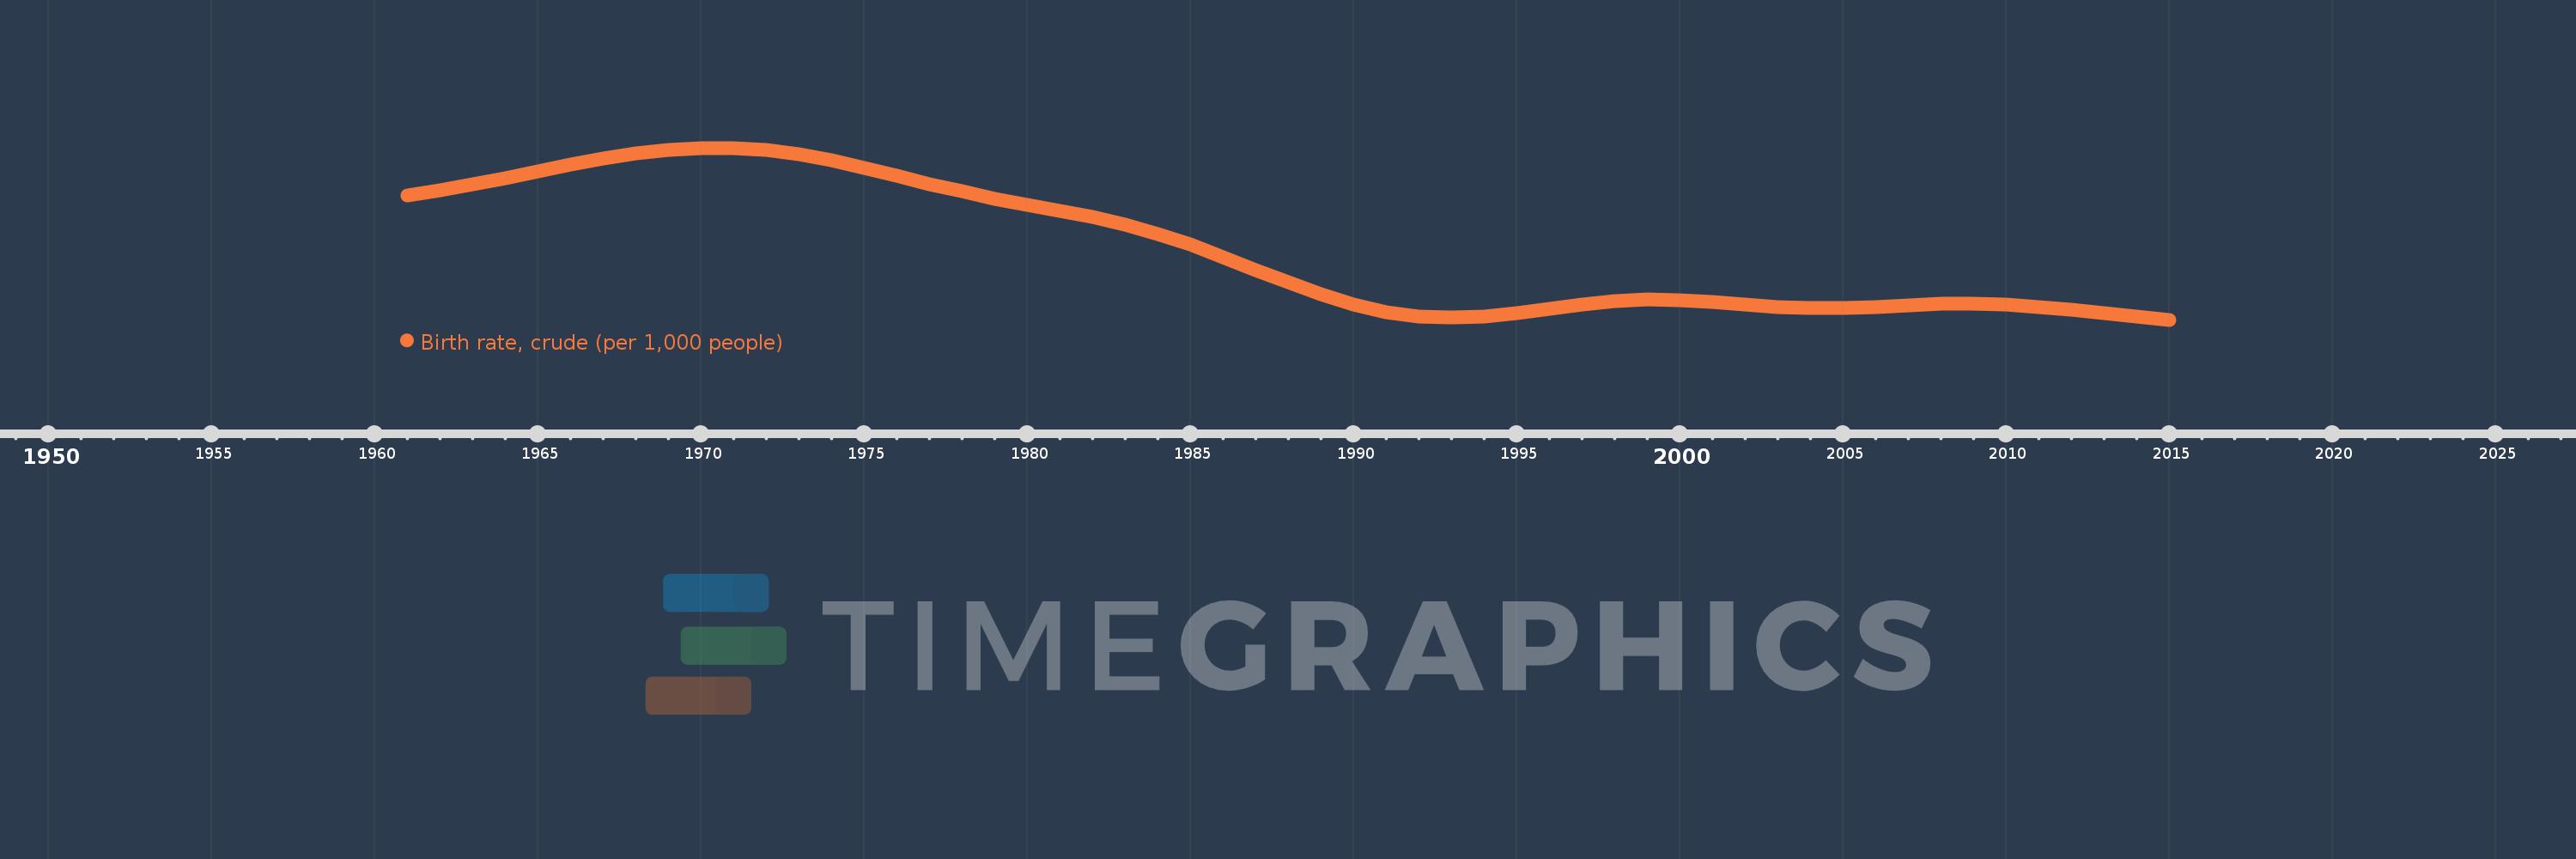
Birth rate, crude (per 1,000 people)
2015,2014,2013,2012,2011,2010,2009,2008,2007,2006,2005,2004,2003,2002,2001,2000,1999,1998,1997,1996,1995,1994,1993,1992,1991,1990,1989,1988,1987,1986,1985,1984,1983,1982,1981,1980,1979,1978,1977,1976,1975,1974,1973,1972,1971,1970,1969,1968,1967,1966,1965,1964,1963,1962,1961
This statistics in other country:
AfghanistanAlbaniaAlgeriaAmerican SamoaAndorraAngolaAntigua and BarbudaArab WorldArgentinaArmeniaArubaAustraliaAustriaAzerbaijanBahamas, TheBahrainBangladeshBarbadosBelarusBelgiumBelizeBeninBermudaBhutanBoliviaBosnia and HerzegovinaBotswanaBrazilBrunei DarussalamBulgariaBurkina FasoBurundiCabo VerdeCambodiaCameroonCanadaCaribbean small statesCayman IslandsCentral African RepublicCentral Europe and the BalticsChadChannel IslandsChileChinaColombiaComorosCongo, Dem. Rep.Congo, Rep.Costa RicaCote d'IvoireCroatiaCubaCuracaoCyprusCzech RepublicDenmarkDjiboutiDominicaDominican RepublicEarly-demographic dividendEast Asia & PacificEast Asia & Pacific (excluding high income)East Asia & Pacific (IDA & IBRD countries)EcuadorEgypt, Arab Rep.El SalvadorEquatorial GuineaEritreaEstoniaEthiopiaEuro areaEurope & Central AsiaEurope & Central Asia (excluding high income)Europe & Central Asia (IDA & IBRD countries)European UnionFaroe IslandsFijiFinlandFragile and conflict affected situationsFranceFrench PolynesiaGabonGambia, TheGeorgiaGermanyGhanaGreeceGreenlandGrenadaGuamGuatemalaGuineaGuinea-BissauGuyanaHaitiHeavily indebted poor countries (HIPC)High incomeHondurasHong Kong SAR, ChinaHungaryIBRD onlyIcelandIDA & IBRD totalIDA blendIDA onlyIDA totalIndiaIndonesiaIran, Islamic Rep.IraqIrelandIsle of ManIsraelItalyJamaicaJapanJordanKazakhstanKenyaKiribatiKorea, Dem. People’s Rep.Korea, Rep.KosovoKuwaitKyrgyz RepublicLao PDRLate-demographic dividendLatin America & Caribbean Latin America & Caribbean (excluding high income)Latin America & the Caribbean (IDA & IBRD countries)LatviaLeast developed countries: UN classificationLebanonLesothoLiberiaLibyaLiechtensteinLithuaniaLow & middle incomeLow incomeLower middle incomeLuxembourgMacao SAR, ChinaMacedonia, FYRMadagascarMalawiMalaysiaMaldivesMaliMaltaMarshall IslandsMauritaniaMauritiusMexicoMicronesia, Fed. Sts.Middle East & North AfricaMiddle East & North Africa (excluding high income)Middle East & North Africa (IDA & IBRD countries)Middle incomeMoldovaMonacoMongoliaMontenegroMoroccoMozambiqueMyanmarNamibiaNepalNetherlandsNew CaledoniaNew ZealandNicaraguaNigerNigeriaNorth AmericaNorwayOECD membersOmanOther small statesPacific island small statesPakistanPalauPanamaPapua New GuineaParaguayPeruPhilippinesPolandPortugalPost-demographic dividendPre-demographic dividendPuerto RicoQatarRomaniaRussian FederationRwandaSamoaSan MarinoSao Tome and PrincipeSaudi ArabiaSenegalSerbiaSeychellesSierra LeoneSingaporeSint Maarten (Dutch part)Slovak RepublicSloveniaSmall statesSolomon IslandsSomaliaSouth AfricaSouth AsiaSouth Asia (IDA & IBRD)South SudanSpainSri LankaSt. Kitts and NevisSt. LuciaSt. Martin (French part)St. Vincent and the GrenadinesSub-Saharan Africa Sub-Saharan Africa (excluding high income)Sub-Saharan Africa (IDA & IBRD countries)SudanSurinameSwazilandSwedenSwitzerlandSyrian Arab RepublicTajikistanTanzaniaThailandTimor-LesteTogoTongaTrinidad and TobagoTunisiaTurkeyTurkmenistanUgandaUkraineUnited Arab EmiratesUnited KingdomUnited StatesUpper middle incomeUruguayUzbekistanVanuatuVenezuela, RBVietnamVirgin Islands (U.S.)West Bank and GazaWorldYemen, Rep.ZambiaZimbabwe Timeline:
This timeline shows a graph from 1961 to 2015 of Kuwait. No data until 1960. Number of actual observations by date: 55.
Source name:
World Development Indicators
Source organization:
(1) United Nations Population Division. World Population Prospects, (2) Census reports and other statistical publications from national statistical offices, (3) Eurostat: Demographic Statistics, (4) United Nations Statistical Division. Population and Vital Statistics Reprot (various years), (5) U.S. Census Bureau: International Database, and (6) Secretariat of the Pacific Community: Statistics and Demography Programme.
Categories, topics:
Health
Last updated:
apr 23, 2017
Indicators value changes by year
Minimum:
20.064
jan 1, 2015
Maximum:
49.433
jan 1, 1971
At the date of observation
Value
Absolute change
Change from previous value
jan 1, 1961
41.366
+41.366
0.0%
jan 1, 1962
42.192
+0.826
2.0%
jan 1, 1963
43.198
+1.006
2.38%
jan 1, 1964
44.32
+1.122
2.6%
jan 1, 1965
45.479
+1.159
2.62%
jan 1, 1966
46.594
+1.115
2.45%
jan 1, 1967
47.596
+1.002
2.15%
jan 1, 1968
48.435
+0.839
1.76%
jan 1, 1969
49.058
+0.623
1.29%
jan 1, 1970
49.413
+0.355
0.72%
jan 1, 1971
49.433
+0.02
0.04%
jan 1, 1972
49.069
-0.364
-0.74%
jan 1, 1973
48.351
-0.718
-1.46%
jan 1, 1974
47.336
-1.015
-2.1%
jan 1, 1975
46.079
-1.257
-2.66%
jan 1, 1976
44.689
-1.39
-3.02%
jan 1, 1977
43.294
-1.395
-3.12%
jan 1, 1978
41.982
-1.312
-3.03%
jan 1, 1979
40.797
-1.185
-2.82%
jan 1, 1980
39.742
-1.055
-2.59%
jan 1, 1981
38.732
-1.01
-2.54%
jan 1, 1982
37.633
-1.099
-2.84%
jan 1, 1983
36.32
-1.313
-3.49%
jan 1, 1984
34.727
-1.593
-4.39%
jan 1, 1985
32.87
-1.857
-5.35%
jan 1, 1986
30.8
-2.07
-6.3%
jan 1, 1987
28.604
-2.196
-7.13%
jan 1, 1988
26.433
-2.171
-7.59%
jan 1, 1989
24.436
-1.997
-7.55%
jan 1, 1990
22.716
-1.72
-7.04%
jan 1, 1991
21.414
-1.302
-5.73%
jan 1, 1992
20.648
-0.766
-3.58%
jan 1, 1993
20.402
-0.246
-1.19%
jan 1, 1994
20.607
+0.205
1.0%
jan 1, 1995
21.179
+0.572
2.78%
jan 1, 1996
21.949
+0.77
3.64%
jan 1, 1997
22.701
+0.752
3.43%
jan 1, 1998
23.262
+0.561
2.47%
jan 1, 1999
23.518
+0.256
1.1%
jan 1, 2000
23.438
-0.08
-0.34%
jan 1, 2001
23.09
-0.348
-1.48%
jan 1, 2002
22.627
-0.463
-2.01%
jan 1, 2003
22.237
-0.39
-1.72%
jan 1, 2004
22.045
-0.192
-0.86%
jan 1, 2005
22.074
+0.029
0.13%
jan 1, 2006
22.275
+0.201
0.91%
jan 1, 2007
22.547
+0.272
1.22%
jan 1, 2008
22.749
+0.202
0.9%
jan 1, 2009
22.781
+0.032
0.14%
jan 1, 2010
22.612
-0.169
-0.74%
jan 1, 2011
22.251
-0.361
-1.6%
jan 1, 2012
21.743
-0.508
-2.28%
jan 1, 2013
21.171
-0.572
-2.63%
jan 1, 2014
20.603
-0.568
-2.68%
jan 1, 2015
20.064
-0.539
-2.62%
Ranking of countries by current statistics by years


Comments: