29
/
en
AIzaSyAYiBZKx7MnpbEhh9jyipgxe19OcubqV5w
April 1, 2024
43226
Latin America & the Caribbean (IDA & IBRD countries)
TLA
false
2
1
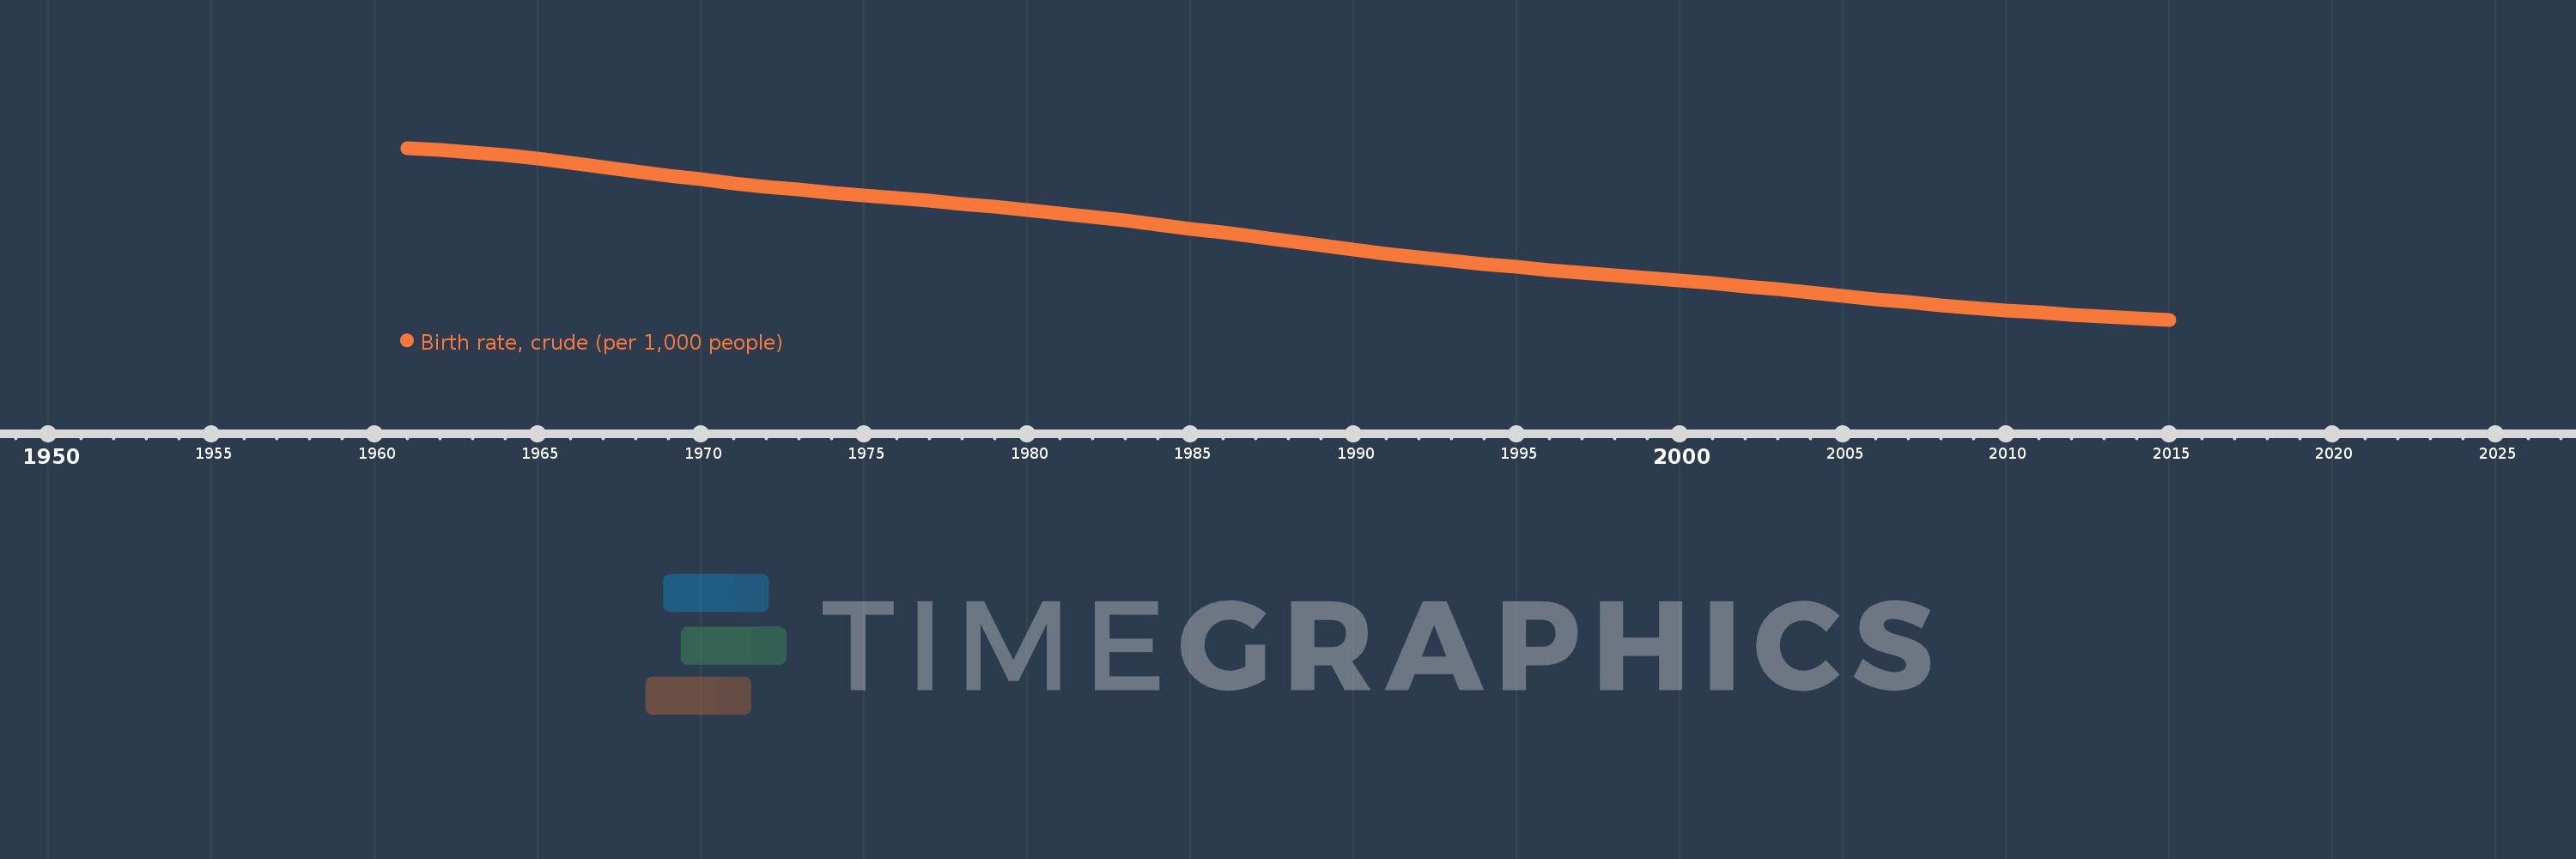
Birth rate, crude (per 1,000 people)
2015,2014,2013,2012,2011,2010,2009,2008,2007,2006,2005,2004,2003,2002,2001,2000,1999,1998,1997,1996,1995,1994,1993,1992,1991,1990,1989,1988,1987,1986,1985,1984,1983,1982,1981,1980,1979,1978,1977,1976,1975,1974,1973,1972,1971,1970,1969,1968,1967,1966,1965,1964,1963,1962,1961
This statistics in other country:
AfghanistanAlbaniaAlgeriaAmerican SamoaAndorraAngolaAntigua and BarbudaArab WorldArgentinaArmeniaArubaAustraliaAustriaAzerbaijanBahamas, TheBahrainBangladeshBarbadosBelarusBelgiumBelizeBeninBermudaBhutanBoliviaBosnia and HerzegovinaBotswanaBrazilBrunei DarussalamBulgariaBurkina FasoBurundiCabo VerdeCambodiaCameroonCanadaCaribbean small statesCayman IslandsCentral African RepublicCentral Europe and the BalticsChadChannel IslandsChileChinaColombiaComorosCongo, Dem. Rep.Congo, Rep.Costa RicaCote d'IvoireCroatiaCubaCuracaoCyprusCzech RepublicDenmarkDjiboutiDominicaDominican RepublicEarly-demographic dividendEast Asia & PacificEast Asia & Pacific (excluding high income)East Asia & Pacific (IDA & IBRD countries)EcuadorEgypt, Arab Rep.El SalvadorEquatorial GuineaEritreaEstoniaEthiopiaEuro areaEurope & Central AsiaEurope & Central Asia (excluding high income)Europe & Central Asia (IDA & IBRD countries)European UnionFaroe IslandsFijiFinlandFragile and conflict affected situationsFranceFrench PolynesiaGabonGambia, TheGeorgiaGermanyGhanaGreeceGreenlandGrenadaGuamGuatemalaGuineaGuinea-BissauGuyanaHaitiHeavily indebted poor countries (HIPC)High incomeHondurasHong Kong SAR, ChinaHungaryIBRD onlyIcelandIDA & IBRD totalIDA blendIDA onlyIDA totalIndiaIndonesiaIran, Islamic Rep.IraqIrelandIsle of ManIsraelItalyJamaicaJapanJordanKazakhstanKenyaKiribatiKorea, Dem. People’s Rep.Korea, Rep.KosovoKuwaitKyrgyz RepublicLao PDRLate-demographic dividendLatin America & Caribbean Latin America & Caribbean (excluding high income)Latin America & the Caribbean (IDA & IBRD countries)LatviaLeast developed countries: UN classificationLebanonLesothoLiberiaLibyaLiechtensteinLithuaniaLow & middle incomeLow incomeLower middle incomeLuxembourgMacao SAR, ChinaMacedonia, FYRMadagascarMalawiMalaysiaMaldivesMaliMaltaMarshall IslandsMauritaniaMauritiusMexicoMicronesia, Fed. Sts.Middle East & North AfricaMiddle East & North Africa (excluding high income)Middle East & North Africa (IDA & IBRD countries)Middle incomeMoldovaMonacoMongoliaMontenegroMoroccoMozambiqueMyanmarNamibiaNepalNetherlandsNew CaledoniaNew ZealandNicaraguaNigerNigeriaNorth AmericaNorwayOECD membersOmanOther small statesPacific island small statesPakistanPalauPanamaPapua New GuineaParaguayPeruPhilippinesPolandPortugalPost-demographic dividendPre-demographic dividendPuerto RicoQatarRomaniaRussian FederationRwandaSamoaSan MarinoSao Tome and PrincipeSaudi ArabiaSenegalSerbiaSeychellesSierra LeoneSingaporeSint Maarten (Dutch part)Slovak RepublicSloveniaSmall statesSolomon IslandsSomaliaSouth AfricaSouth AsiaSouth Asia (IDA & IBRD)South SudanSpainSri LankaSt. Kitts and NevisSt. LuciaSt. Martin (French part)St. Vincent and the GrenadinesSub-Saharan Africa Sub-Saharan Africa (excluding high income)Sub-Saharan Africa (IDA & IBRD countries)SudanSurinameSwazilandSwedenSwitzerlandSyrian Arab RepublicTajikistanTanzaniaThailandTimor-LesteTogoTongaTrinidad and TobagoTunisiaTurkeyTurkmenistanUgandaUkraineUnited Arab EmiratesUnited KingdomUnited StatesUpper middle incomeUruguayUzbekistanVanuatuVenezuela, RBVietnamVirgin Islands (U.S.)West Bank and GazaWorldYemen, Rep.ZambiaZimbabwe Timeline:
This timeline shows a graph from 1961 to 2015 of Latin America & the Caribbean (IDA & IBRD countries). No data until 1960. Number of actual observations by date: 55.
Source name:
World Development Indicators
Source organization:
(1) United Nations Population Division. World Population Prospects, (2) Census reports and other statistical publications from national statistical offices, (3) Eurostat: Demographic Statistics, (4) United Nations Statistical Division. Population and Vital Statistics Reprot (various years), (5) U.S. Census Bureau: International Database, and (6) Secretariat of the Pacific Community: Statistics and Demography Programme.
Categories, topics:
Health
Last updated:
apr 23, 2017
Indicators value changes by year
Minimum:
17.501
jan 1, 2015
Maximum:
42.017
jan 1, 1961
At the date of observation
Value
Absolute change
Change from previous value
jan 1, 1961
42.017
+42.017
0.0%
jan 1, 1962
41.751
-0.266
-0.63%
jan 1, 1963
41.41
-0.34
-0.81%
jan 1, 1964
40.988
-0.423
-1.02%
jan 1, 1965
40.487
-0.501
-1.22%
jan 1, 1966
39.922
-0.565
-1.4%
jan 1, 1967
39.314
-0.608
-1.52%
jan 1, 1968
38.695
-0.619
-1.57%
jan 1, 1969
38.091
-0.604
-1.56%
jan 1, 1970
37.518
-0.573
-1.5%
jan 1, 1971
36.985
-0.533
-1.42%
jan 1, 1972
36.511
-0.475
-1.28%
jan 1, 1973
36.069
-0.441
-1.21%
jan 1, 1974
35.65
-0.419
-1.16%
jan 1, 1975
35.246
-0.404
-1.13%
jan 1, 1976
34.848
-0.398
-1.13%
jan 1, 1977
34.448
-0.401
-1.15%
jan 1, 1978
34.038
-0.41
-1.19%
jan 1, 1979
33.61
-0.428
-1.26%
jan 1, 1980
33.16
-0.45
-1.34%
jan 1, 1981
32.683
-0.477
-1.44%
jan 1, 1982
32.174
-0.509
-1.56%
jan 1, 1983
31.639
-0.536
-1.66%
jan 1, 1984
31.08
-0.559
-1.77%
jan 1, 1985
30.502
-0.577
-1.86%
jan 1, 1986
29.912
-0.59
-1.94%
jan 1, 1987
29.308
-0.603
-2.02%
jan 1, 1988
28.7
-0.608
-2.07%
jan 1, 1989
28.098
-0.602
-2.1%
jan 1, 1990
27.509
-0.589
-2.1%
jan 1, 1991
26.94
-0.569
-2.07%
jan 1, 1992
26.411
-0.529
-1.96%
jan 1, 1993
25.912
-0.499
-1.89%
jan 1, 1994
25.449
-0.462
-1.78%
jan 1, 1995
25.025
-0.425
-1.67%
jan 1, 1996
24.633
-0.392
-1.57%
jan 1, 1997
24.243
-0.389
-1.58%
jan 1, 1998
23.875
-0.368
-1.52%
jan 1, 1999
23.501
-0.375
-1.57%
jan 1, 2000
23.119
-0.382
-1.62%
jan 1, 2001
22.725
-0.394
-1.7%
jan 1, 2002
22.296
-0.429
-1.89%
jan 1, 2003
21.848
-0.448
-2.01%
jan 1, 2004
21.383
-0.465
-2.13%
jan 1, 2005
20.908
-0.475
-2.22%
jan 1, 2006
20.439
-0.469
-2.24%
jan 1, 2007
19.979
-0.46
-2.25%
jan 1, 2008
19.558
-0.421
-2.11%
jan 1, 2009
19.176
-0.382
-1.95%
jan 1, 2010
18.835
-0.341
-1.78%
jan 1, 2011
18.529
-0.306
-1.62%
jan 1, 2012
18.258
-0.271
-1.46%
jan 1, 2013
18.004
-0.254
-1.39%
jan 1, 2014
17.75
-0.253
-1.41%
jan 1, 2015
17.501
-0.249
-1.4%
Ranking of countries by current statistics by years


Comments: