29
/
en
AIzaSyAYiBZKx7MnpbEhh9jyipgxe19OcubqV5w
April 1, 2024
51689
North America
NAC
false
2
1
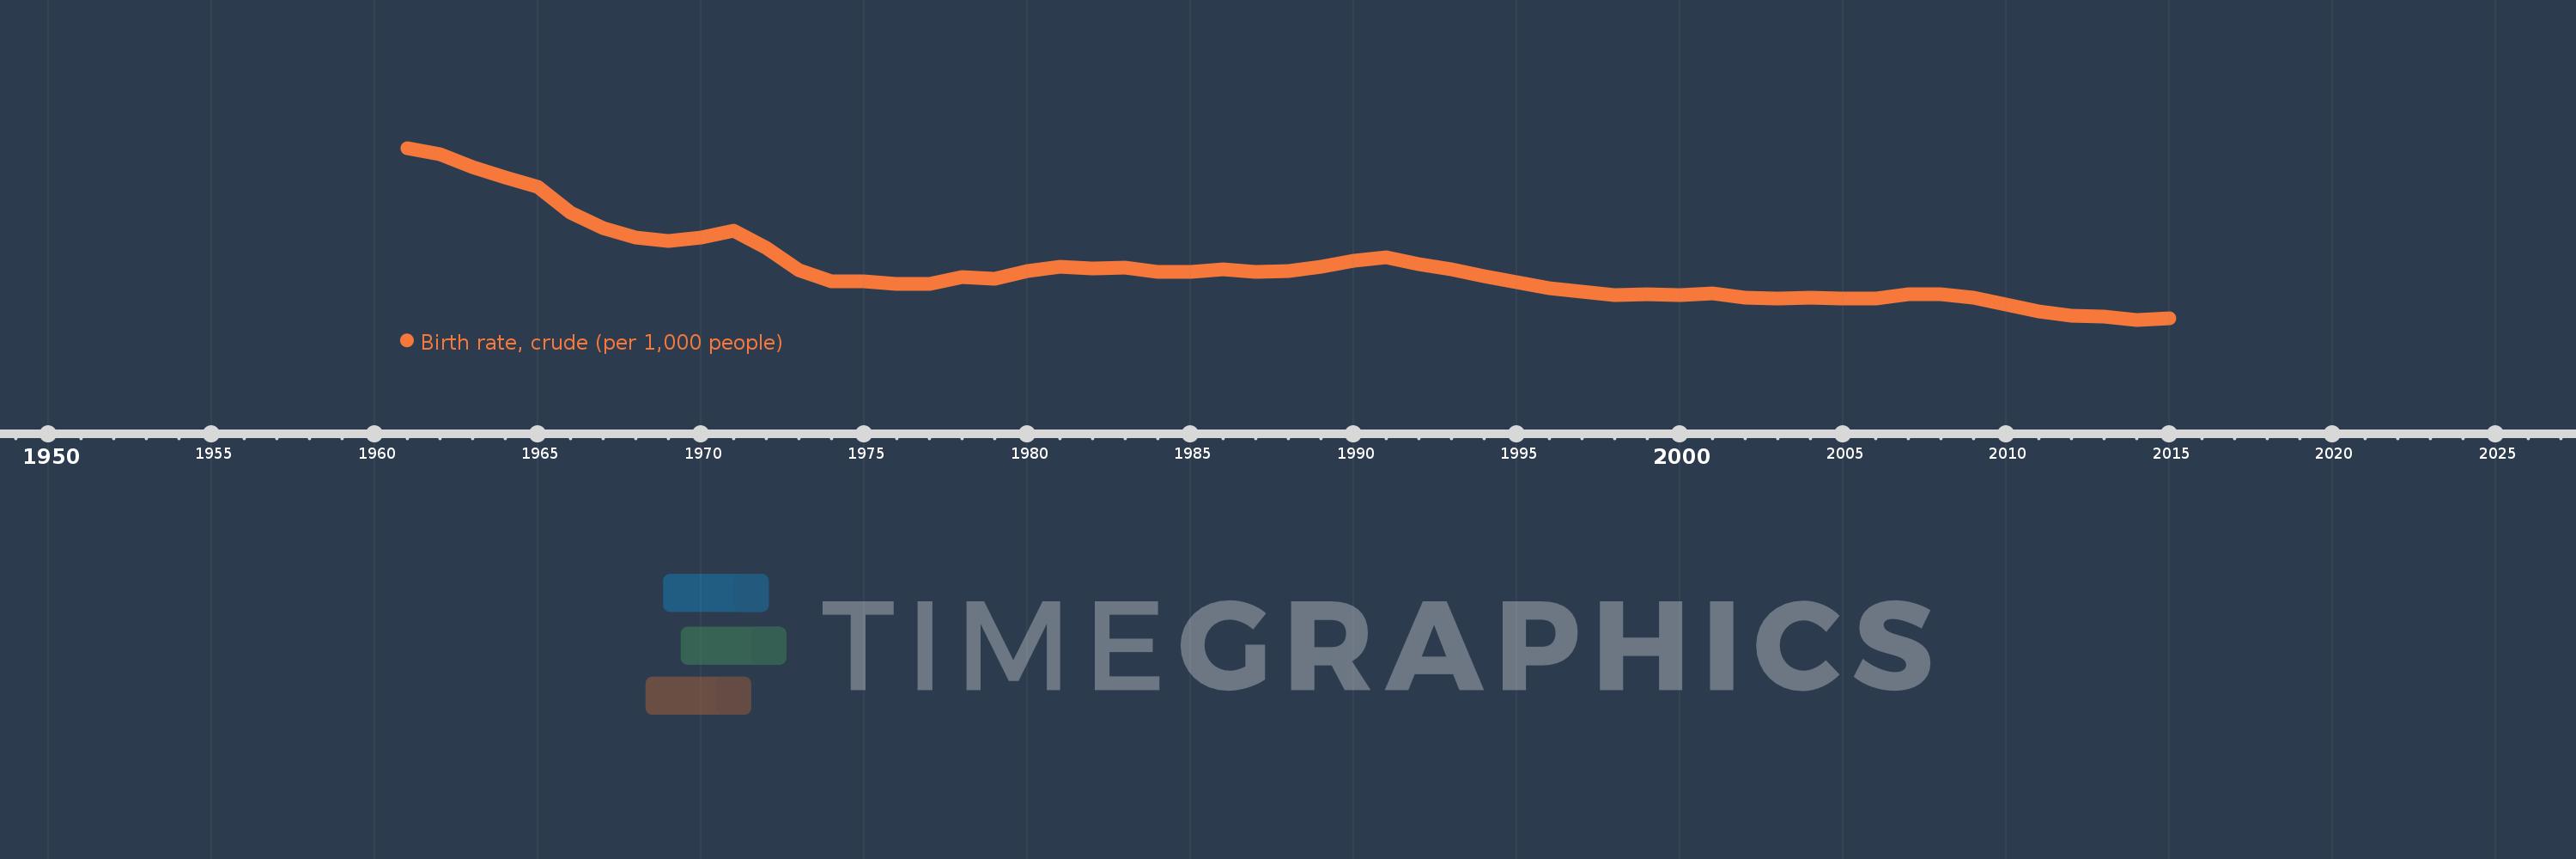
Birth rate, crude (per 1,000 people)
2015,2014,2013,2012,2011,2010,2009,2008,2007,2006,2005,2004,2003,2002,2001,2000,1999,1998,1997,1996,1995,1994,1993,1992,1991,1990,1989,1988,1987,1986,1985,1984,1983,1982,1981,1980,1979,1978,1977,1976,1975,1974,1973,1972,1971,1970,1969,1968,1967,1966,1965,1964,1963,1962,1961
This statistics in other country:
AfghanistanAlbaniaAlgeriaAmerican SamoaAndorraAngolaAntigua and BarbudaArab WorldArgentinaArmeniaArubaAustraliaAustriaAzerbaijanBahamas, TheBahrainBangladeshBarbadosBelarusBelgiumBelizeBeninBermudaBhutanBoliviaBosnia and HerzegovinaBotswanaBrazilBrunei DarussalamBulgariaBurkina FasoBurundiCabo VerdeCambodiaCameroonCanadaCaribbean small statesCayman IslandsCentral African RepublicCentral Europe and the BalticsChadChannel IslandsChileChinaColombiaComorosCongo, Dem. Rep.Congo, Rep.Costa RicaCote d'IvoireCroatiaCubaCuracaoCyprusCzech RepublicDenmarkDjiboutiDominicaDominican RepublicEarly-demographic dividendEast Asia & PacificEast Asia & Pacific (excluding high income)East Asia & Pacific (IDA & IBRD countries)EcuadorEgypt, Arab Rep.El SalvadorEquatorial GuineaEritreaEstoniaEthiopiaEuro areaEurope & Central AsiaEurope & Central Asia (excluding high income)Europe & Central Asia (IDA & IBRD countries)European UnionFaroe IslandsFijiFinlandFragile and conflict affected situationsFranceFrench PolynesiaGabonGambia, TheGeorgiaGermanyGhanaGreeceGreenlandGrenadaGuamGuatemalaGuineaGuinea-BissauGuyanaHaitiHeavily indebted poor countries (HIPC)High incomeHondurasHong Kong SAR, ChinaHungaryIBRD onlyIcelandIDA & IBRD totalIDA blendIDA onlyIDA totalIndiaIndonesiaIran, Islamic Rep.IraqIrelandIsle of ManIsraelItalyJamaicaJapanJordanKazakhstanKenyaKiribatiKorea, Dem. People’s Rep.Korea, Rep.KosovoKuwaitKyrgyz RepublicLao PDRLate-demographic dividendLatin America & Caribbean Latin America & Caribbean (excluding high income)Latin America & the Caribbean (IDA & IBRD countries)LatviaLeast developed countries: UN classificationLebanonLesothoLiberiaLibyaLiechtensteinLithuaniaLow & middle incomeLow incomeLower middle incomeLuxembourgMacao SAR, ChinaMacedonia, FYRMadagascarMalawiMalaysiaMaldivesMaliMaltaMarshall IslandsMauritaniaMauritiusMexicoMicronesia, Fed. Sts.Middle East & North AfricaMiddle East & North Africa (excluding high income)Middle East & North Africa (IDA & IBRD countries)Middle incomeMoldovaMonacoMongoliaMontenegroMoroccoMozambiqueMyanmarNamibiaNepalNetherlandsNew CaledoniaNew ZealandNicaraguaNigerNigeriaNorth AmericaNorwayOECD membersOmanOther small statesPacific island small statesPakistanPalauPanamaPapua New GuineaParaguayPeruPhilippinesPolandPortugalPost-demographic dividendPre-demographic dividendPuerto RicoQatarRomaniaRussian FederationRwandaSamoaSan MarinoSao Tome and PrincipeSaudi ArabiaSenegalSerbiaSeychellesSierra LeoneSingaporeSint Maarten (Dutch part)Slovak RepublicSloveniaSmall statesSolomon IslandsSomaliaSouth AfricaSouth AsiaSouth Asia (IDA & IBRD)South SudanSpainSri LankaSt. Kitts and NevisSt. LuciaSt. Martin (French part)St. Vincent and the GrenadinesSub-Saharan Africa Sub-Saharan Africa (excluding high income)Sub-Saharan Africa (IDA & IBRD countries)SudanSurinameSwazilandSwedenSwitzerlandSyrian Arab RepublicTajikistanTanzaniaThailandTimor-LesteTogoTongaTrinidad and TobagoTunisiaTurkeyTurkmenistanUgandaUkraineUnited Arab EmiratesUnited KingdomUnited StatesUpper middle incomeUruguayUzbekistanVanuatuVenezuela, RBVietnamVirgin Islands (U.S.)West Bank and GazaWorldYemen, Rep.ZambiaZimbabwe Timeline:
This timeline shows a graph from 1961 to 2015 of North America. No data until 1960. Number of actual observations by date: 55.
Source name:
World Development Indicators
Source organization:
(1) United Nations Population Division. World Population Prospects, (2) Census reports and other statistical publications from national statistical offices, (3) Eurostat: Demographic Statistics, (4) United Nations Statistical Division. Population and Vital Statistics Reprot (various years), (5) U.S. Census Bureau: International Database, and (6) Secretariat of the Pacific Community: Statistics and Demography Programme.
Categories, topics:
Health
Last updated:
apr 23, 2017
Indicators value changes by year
Maximum:
23.972
jan 1, 1961
At the date of observation
Value
Absolute change
Change from previous value
jan 1, 1961
23.972
+23.972
0.0%
jan 1, 1962
23.544
-0.427
-1.78%
jan 1, 1963
22.655
-0.889
-3.78%
jan 1, 1964
21.964
-0.691
-3.05%
jan 1, 1965
21.31
-0.654
-2.98%
jan 1, 1966
19.575
-1.736
-8.14%
jan 1, 1967
18.484
-1.091
-5.57%
jan 1, 1968
17.837
-0.646
-3.5%
jan 1, 1969
17.6
-0.237
-1.33%
jan 1, 1970
17.872
+0.272
1.54%
jan 1, 1971
18.306
+0.434
2.43%
jan 1, 1972
17.162
-1.144
-6.25%
jan 1, 1973
15.628
-1.534
-8.94%
jan 1, 1974
14.876
-0.752
-4.81%
jan 1, 1975
14.858
-0.019
-0.13%
jan 1, 1976
14.716
-0.141
-0.95%
jan 1, 1977
14.697
-0.019
-0.13%
jan 1, 1978
15.139
+0.441
3.0%
jan 1, 1979
15.019
-0.12
-0.79%
jan 1, 1980
15.58
+0.561
3.74%
jan 1, 1981
15.851
+0.271
1.74%
jan 1, 1982
15.751
-0.1
-0.63%
jan 1, 1983
15.822
+0.07
0.45%
jan 1, 1984
15.541
-0.28
-1.77%
jan 1, 1985
15.541
0.0
0.0%
jan 1, 1986
15.712
+0.171
1.1%
jan 1, 1987
15.492
-0.22
-1.4%
jan 1, 1988
15.572
+0.08
0.52%
jan 1, 1989
15.851
+0.28
1.8%
jan 1, 1990
16.25
+0.399
2.51%
jan 1, 1991
16.529
+0.279
1.72%
jan 1, 1992
16.07
-0.46
-2.78%
jan 1, 1993
15.69
-0.38
-2.36%
jan 1, 1994
15.22
-0.47
-3.0%
jan 1, 1995
14.811
-0.409
-2.69%
jan 1, 1996
14.401
-0.409
-2.76%
jan 1, 1997
14.162
-0.239
-1.66%
jan 1, 1998
13.942
-0.219
-1.55%
jan 1, 1999
14.013
+0.071
0.51%
jan 1, 2000
13.904
-0.109
-0.78%
jan 1, 2001
14.056
+0.151
1.09%
jan 1, 2002
13.756
-0.3
-2.13%
jan 1, 2003
13.675
-0.08
-0.58%
jan 1, 2004
13.746
+0.07
0.51%
jan 1, 2005
13.67
-0.076
-0.55%
jan 1, 2006
13.67
0.0
0.0%
jan 1, 2007
13.965
+0.295
2.16%
jan 1, 2008
13.995
+0.03
0.21%
jan 1, 2009
13.734
-0.261
-1.87%
jan 1, 2010
13.283
-0.451
-3.29%
jan 1, 2011
12.812
-0.471
-3.55%
jan 1, 2012
12.531
-0.281
-2.19%
jan 1, 2013
12.44
-0.091
-0.72%
jan 1, 2014
12.25
-0.19
-1.53%
jan 1, 2015
12.339
+0.09
0.73%
Ranking of countries by current statistics by years


Comments: