29
/
en
AIzaSyAYiBZKx7MnpbEhh9jyipgxe19OcubqV5w
April 1, 2024
82135
Belgium
BEL
true
2
1
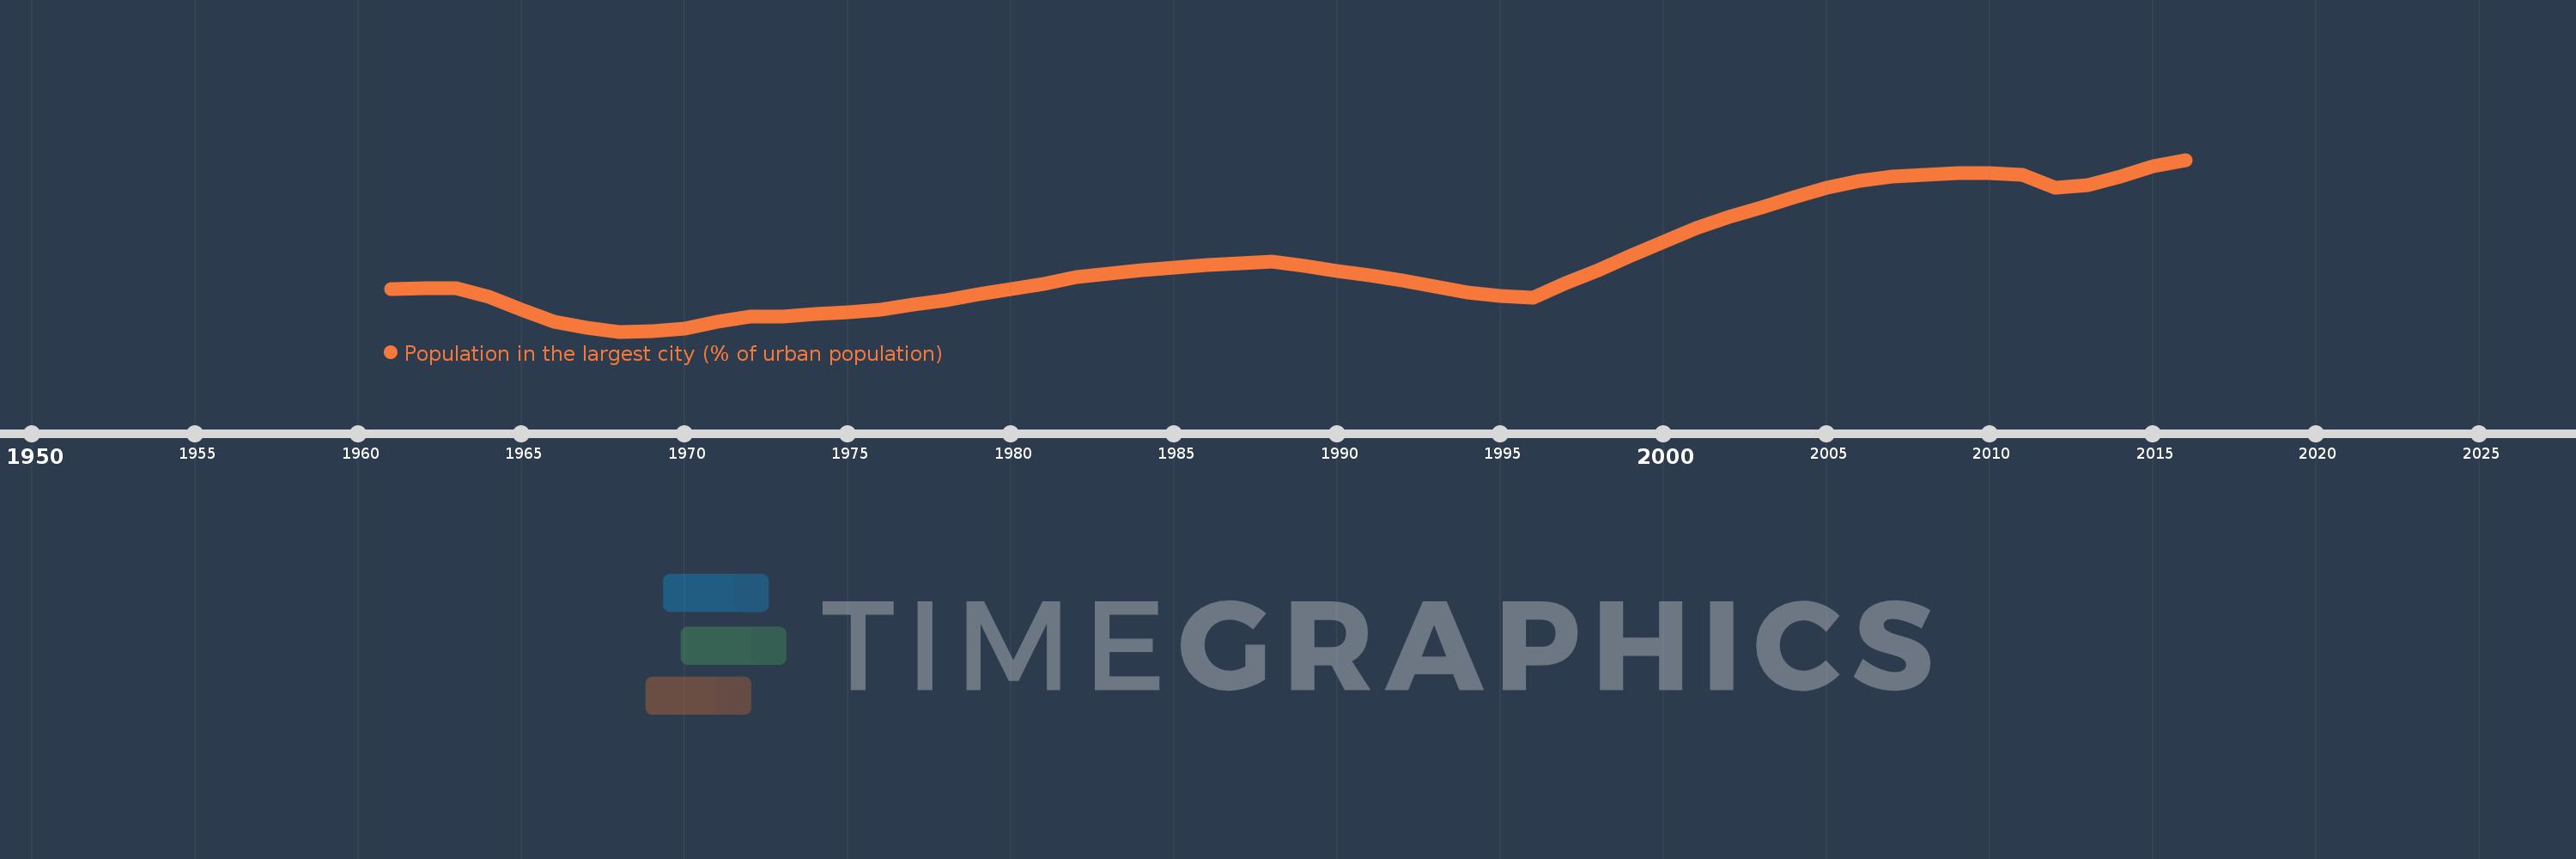
Population in the largest city (% of urban population)
2016,2015,2014,2013,2012,2011,2010,2009,2008,2007,2006,2005,2004,2003,2002,2001,2000,1999,1998,1997,1996,1995,1994,1993,1992,1991,1990,1989,1988,1987,1986,1985,1984,1983,1982,1981,1980,1979,1978,1977,1976,1975,1974,1973,1972,1971,1970,1969,1968,1967,1966,1965,1964,1963,1962,1961
This statistics in other country:
AfghanistanAlbaniaAlgeriaAngolaArab WorldArgentinaArmeniaAustraliaAustriaAzerbaijanBahrainBangladeshBelarusBelgiumBeninBoliviaBosnia and HerzegovinaBrazilBulgariaBurkina FasoBurundiCambodiaCameroonCanadaCentral African RepublicCentral Europe and the BalticsChadChileChinaColombiaCongo, Dem. Rep.Congo, Rep.Costa RicaCote d'IvoireCroatiaCubaCzech RepublicDenmarkDjiboutiDominican RepublicEarly-demographic dividendEast Asia & PacificEast Asia & Pacific (excluding high income)East Asia & Pacific (IDA & IBRD countries)EcuadorEgypt, Arab Rep.El SalvadorEritreaEstoniaEthiopiaEuro areaEurope & Central AsiaEurope & Central Asia (excluding high income)Europe & Central Asia (IDA & IBRD countries)European UnionFinlandFragile and conflict affected situationsFranceGabonGambia, TheGeorgiaGermanyGhanaGreeceGuatemalaGuineaGuinea-BissauHaitiHeavily indebted poor countries (HIPC)High incomeHondurasHong Kong SAR, ChinaHungaryIBRD onlyIDA & IBRD totalIDA blendIDA onlyIDA totalIndiaIndonesiaIran, Islamic Rep.IraqIrelandIsraelItalyJamaicaJapanJordanKazakhstanKenyaKorea, Dem. People’s Rep.Korea, Rep.KuwaitKyrgyz RepublicLao PDRLate-demographic dividendLatin America & Caribbean Latin America & Caribbean (excluding high income)Latin America & the Caribbean (IDA & IBRD countries)LatviaLeast developed countries: UN classificationLebanonLiberiaLibyaLithuaniaLow & middle incomeLow incomeLower middle incomeMacao SAR, ChinaMacedonia, FYRMadagascarMalawiMalaysiaMaliMauritaniaMexicoMiddle East & North AfricaMiddle East & North Africa (excluding high income)Middle East & North Africa (IDA & IBRD countries)Middle incomeMoldovaMongoliaMoroccoMozambiqueMyanmarNamibiaNepalNetherlandsNew ZealandNicaraguaNigerNigeriaNorth AmericaNorwayOECD membersOmanPakistanPanamaPapua New GuineaParaguayPeruPhilippinesPolandPortugalPost-demographic dividendPre-demographic dividendPuerto RicoQatarRomaniaRussian FederationRwandaSaudi ArabiaSenegalSerbiaSierra LeoneSingaporeSlovak RepublicSomaliaSouth AfricaSouth AsiaSouth Asia (IDA & IBRD)South SudanSpainSri LankaSub-Saharan Africa Sub-Saharan Africa (excluding high income)Sub-Saharan Africa (IDA & IBRD countries)SudanSwedenSwitzerlandSyrian Arab RepublicTajikistanTanzaniaThailandTogoTunisiaTurkeyTurkmenistanUgandaUkraineUnited Arab EmiratesUnited KingdomUnited StatesUpper middle incomeUruguayUzbekistanVenezuela, RBVietnamWest Bank and GazaWorldYemen, Rep.ZambiaZimbabwe Timeline:
This timeline shows a graph from 1961 to 2016 of Belgium. No data until 1960. Number of actual observations by date: 56.
Source name:
World Development Indicators
Source organization:
United Nations, World Urbanization Prospects.
Categories, topics:
Urban Development
Last updated:
apr 23, 2017
Indicators value changes by year
Minimum:
17.224
jan 1, 1968
Maximum:
18.517
jan 1, 2016
At the date of observation
Value
Absolute change
Change from previous value
jan 1, 1961
17.542
+17.542
0.0%
jan 1, 1962
17.551
+0.008
0.05%
jan 1, 1963
17.548
-0.003
-0.01%
jan 1, 1964
17.485
-0.063
-0.36%
jan 1, 1965
17.388
-0.097
-0.55%
jan 1, 1966
17.299
-0.089
-0.51%
jan 1, 1967
17.251
-0.048
-0.28%
jan 1, 1968
17.224
-0.027
-0.16%
jan 1, 1969
17.226
+0.002
0.01%
jan 1, 1970
17.247
+0.021
0.12%
jan 1, 1971
17.301
+0.054
0.31%
jan 1, 1972
17.339
+0.038
0.22%
jan 1, 1973
17.34
+0.001
0.0%
jan 1, 1974
17.354
+0.014
0.08%
jan 1, 1975
17.369
+0.015
0.09%
jan 1, 1976
17.389
+0.02
0.12%
jan 1, 1977
17.429
+0.04
0.23%
jan 1, 1978
17.463
+0.034
0.19%
jan 1, 1979
17.503
+0.04
0.23%
jan 1, 1980
17.546
+0.043
0.24%
jan 1, 1981
17.586
+0.04
0.23%
jan 1, 1982
17.634
+0.048
0.27%
jan 1, 1983
17.661
+0.026
0.15%
jan 1, 1984
17.684
+0.023
0.13%
jan 1, 1985
17.707
+0.023
0.13%
jan 1, 1986
17.724
+0.018
0.1%
jan 1, 1987
17.741
+0.017
0.1%
jan 1, 1988
17.75
+0.008
0.05%
jan 1, 1989
17.718
-0.032
-0.18%
jan 1, 1990
17.678
-0.04
-0.23%
jan 1, 1991
17.65
-0.028
-0.16%
jan 1, 1992
17.609
-0.041
-0.23%
jan 1, 1993
17.563
-0.046
-0.26%
jan 1, 1994
17.52
-0.043
-0.24%
jan 1, 1995
17.492
-0.028
-0.16%
jan 1, 1996
17.482
-0.011
-0.06%
jan 1, 1997
17.589
+0.108
0.62%
jan 1, 1998
17.689
+0.1
0.57%
jan 1, 1999
17.795
+0.106
0.6%
jan 1, 2000
17.899
+0.104
0.59%
jan 1, 2001
18.003
+0.104
0.58%
jan 1, 2002
18.089
+0.087
0.48%
jan 1, 2003
18.158
+0.069
0.38%
jan 1, 2004
18.233
+0.075
0.41%
jan 1, 2005
18.306
+0.073
0.4%
jan 1, 2006
18.357
+0.051
0.28%
jan 1, 2007
18.388
+0.032
0.17%
jan 1, 2008
18.407
+0.018
0.1%
jan 1, 2009
18.415
+0.008
0.04%
jan 1, 2010
18.42
+0.005
0.03%
jan 1, 2011
18.406
-0.014
-0.08%
jan 1, 2012
18.305
-0.101
-0.55%
jan 1, 2013
18.326
+0.021
0.11%
jan 1, 2014
18.39
+0.064
0.35%
jan 1, 2015
18.466
+0.076
0.41%
jan 1, 2016
18.517
+0.051
0.28%
Ranking of countries by current statistics by years


Comments: