29
/
en
AIzaSyAYiBZKx7MnpbEhh9jyipgxe19OcubqV5w
April 1, 2024
256727
Sweden
SWE
true
2
1
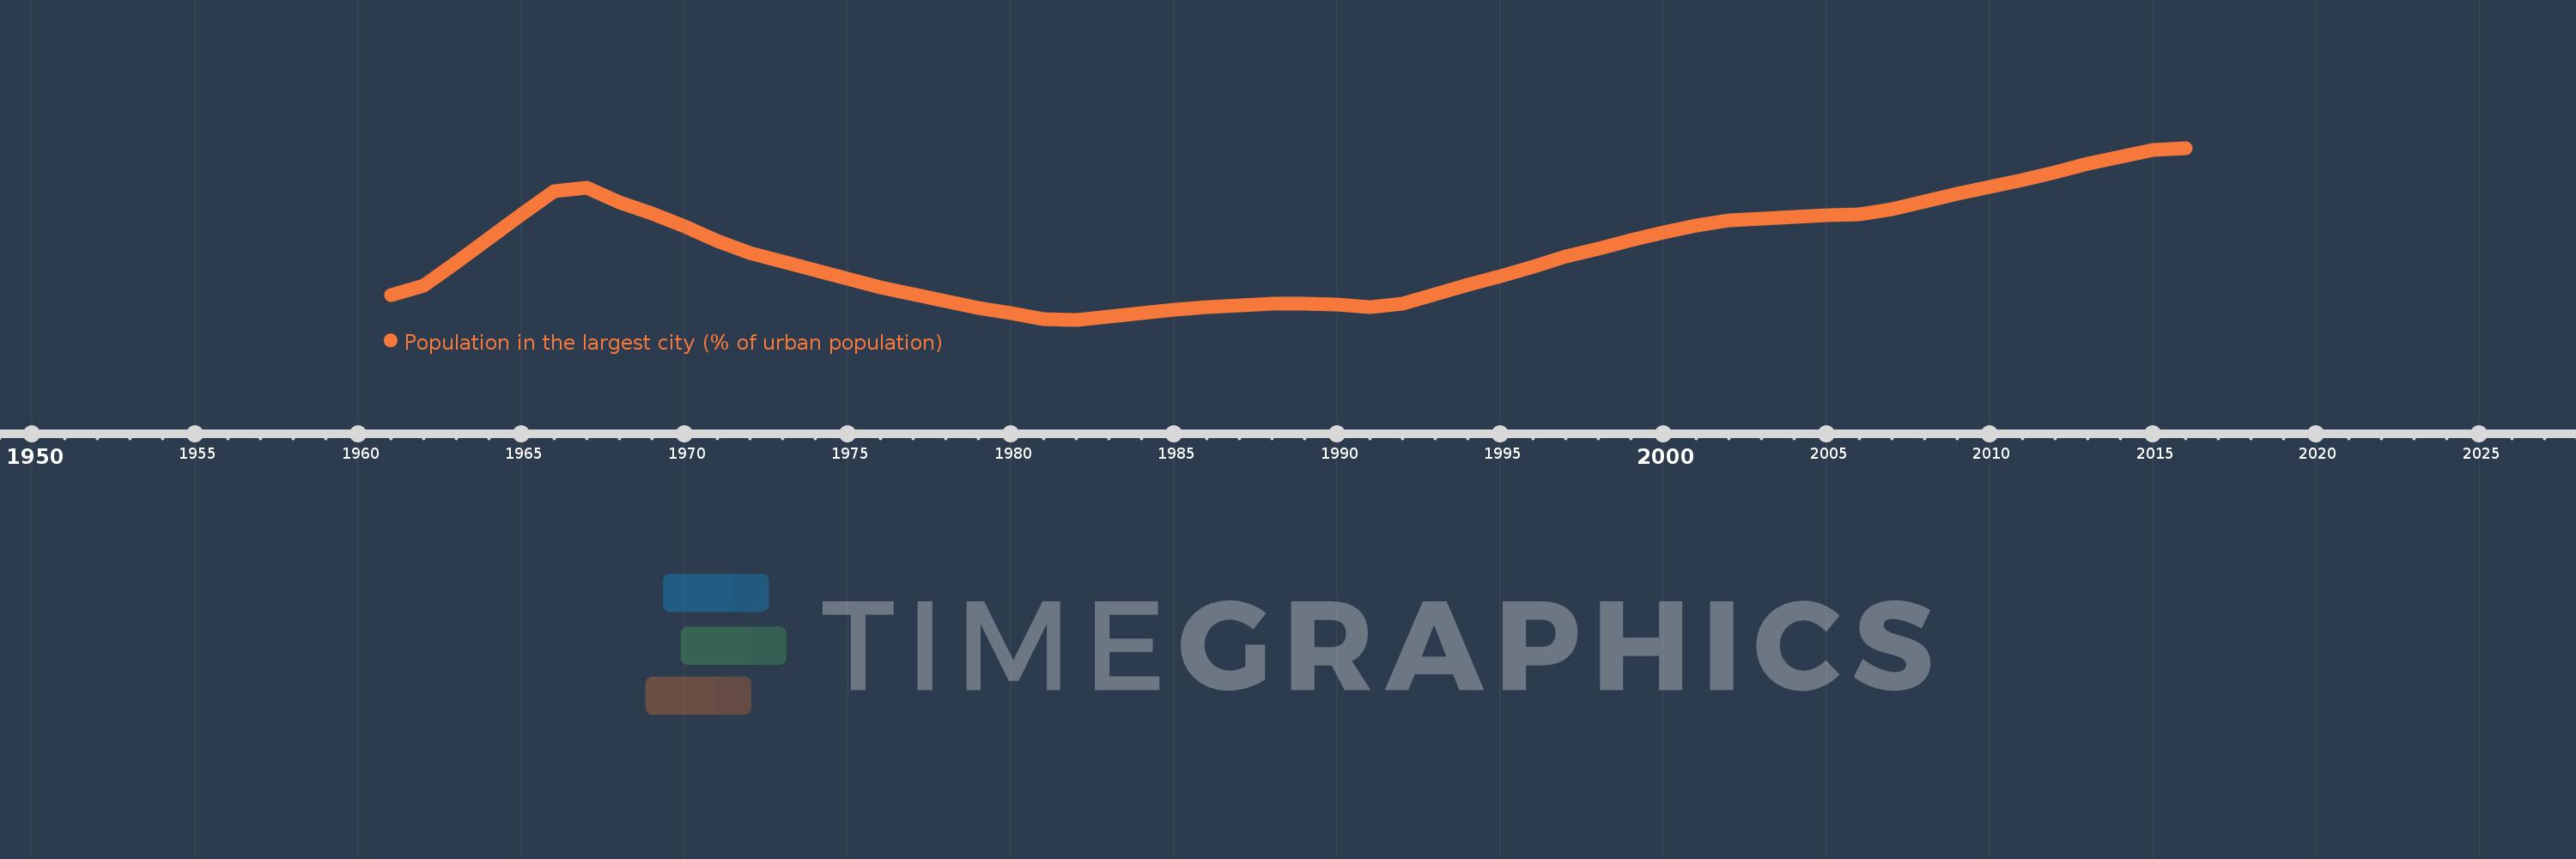
Population in the largest city (% of urban population)
2016,2015,2014,2013,2012,2011,2010,2009,2008,2007,2006,2005,2004,2003,2002,2001,2000,1999,1998,1997,1996,1995,1994,1993,1992,1991,1990,1989,1988,1987,1986,1985,1984,1983,1982,1981,1980,1979,1978,1977,1976,1975,1974,1973,1972,1971,1970,1969,1968,1967,1966,1965,1964,1963,1962,1961
This statistics in other country:
AfghanistanAlbaniaAlgeriaAngolaArab WorldArgentinaArmeniaAustraliaAustriaAzerbaijanBahrainBangladeshBelarusBelgiumBeninBoliviaBosnia and HerzegovinaBrazilBulgariaBurkina FasoBurundiCambodiaCameroonCanadaCentral African RepublicCentral Europe and the BalticsChadChileChinaColombiaCongo, Dem. Rep.Congo, Rep.Costa RicaCote d'IvoireCroatiaCubaCzech RepublicDenmarkDjiboutiDominican RepublicEarly-demographic dividendEast Asia & PacificEast Asia & Pacific (excluding high income)East Asia & Pacific (IDA & IBRD countries)EcuadorEgypt, Arab Rep.El SalvadorEritreaEstoniaEthiopiaEuro areaEurope & Central AsiaEurope & Central Asia (excluding high income)Europe & Central Asia (IDA & IBRD countries)European UnionFinlandFragile and conflict affected situationsFranceGabonGambia, TheGeorgiaGermanyGhanaGreeceGuatemalaGuineaGuinea-BissauHaitiHeavily indebted poor countries (HIPC)High incomeHondurasHong Kong SAR, ChinaHungaryIBRD onlyIDA & IBRD totalIDA blendIDA onlyIDA totalIndiaIndonesiaIran, Islamic Rep.IraqIrelandIsraelItalyJamaicaJapanJordanKazakhstanKenyaKorea, Dem. People’s Rep.Korea, Rep.KuwaitKyrgyz RepublicLao PDRLate-demographic dividendLatin America & Caribbean Latin America & Caribbean (excluding high income)Latin America & the Caribbean (IDA & IBRD countries)LatviaLeast developed countries: UN classificationLebanonLiberiaLibyaLithuaniaLow & middle incomeLow incomeLower middle incomeMacao SAR, ChinaMacedonia, FYRMadagascarMalawiMalaysiaMaliMauritaniaMexicoMiddle East & North AfricaMiddle East & North Africa (excluding high income)Middle East & North Africa (IDA & IBRD countries)Middle incomeMoldovaMongoliaMoroccoMozambiqueMyanmarNamibiaNepalNetherlandsNew ZealandNicaraguaNigerNigeriaNorth AmericaNorwayOECD membersOmanPakistanPanamaPapua New GuineaParaguayPeruPhilippinesPolandPortugalPost-demographic dividendPre-demographic dividendPuerto RicoQatarRomaniaRussian FederationRwandaSaudi ArabiaSenegalSerbiaSierra LeoneSingaporeSlovak RepublicSomaliaSouth AfricaSouth AsiaSouth Asia (IDA & IBRD)South SudanSpainSri LankaSub-Saharan Africa Sub-Saharan Africa (excluding high income)Sub-Saharan Africa (IDA & IBRD countries)SudanSwedenSwitzerlandSyrian Arab RepublicTajikistanTanzaniaThailandTogoTunisiaTurkeyTurkmenistanUgandaUkraineUnited Arab EmiratesUnited KingdomUnited StatesUpper middle incomeUruguayUzbekistanVenezuela, RBVietnamWest Bank and GazaWorldYemen, Rep.ZambiaZimbabwe Timeline:
This timeline shows a graph from 1961 to 2016 of Sweden. No data until 1960. Number of actual observations by date: 56.
Source name:
World Development Indicators
Source organization:
United Nations, World Urbanization Prospects.
Categories, topics:
Urban Development
Last updated:
apr 23, 2017
Indicators value changes by year
Minimum:
14.346
jan 1, 1982
Maximum:
17.668
jan 1, 2016
At the date of observation
Value
Absolute change
Change from previous value
jan 1, 1961
14.83
+14.83
0.0%
jan 1, 1962
15.013
+0.184
1.24%
jan 1, 1963
15.46
+0.446
2.97%
jan 1, 1964
15.925
+0.466
3.01%
jan 1, 1965
16.383
+0.458
2.88%
jan 1, 1966
16.827
+0.444
2.71%
jan 1, 1967
16.9
+0.073
0.43%
jan 1, 1968
16.624
-0.276
-1.63%
jan 1, 1969
16.393
-0.231
-1.39%
jan 1, 1970
16.148
-0.245
-1.49%
jan 1, 1971
15.876
-0.272
-1.68%
jan 1, 1972
15.642
-0.234
-1.47%
jan 1, 1973
15.464
-0.178
-1.14%
jan 1, 1974
15.308
-0.156
-1.01%
jan 1, 1975
15.136
-0.172
-1.12%
jan 1, 1976
14.969
-0.167
-1.1%
jan 1, 1977
14.834
-0.135
-0.9%
jan 1, 1978
14.702
-0.132
-0.89%
jan 1, 1979
14.58
-0.122
-0.83%
jan 1, 1980
14.469
-0.11
-0.76%
jan 1, 1981
14.362
-0.107
-0.74%
jan 1, 1982
14.346
-0.016
-0.11%
jan 1, 1983
14.411
+0.065
0.45%
jan 1, 1984
14.477
+0.067
0.46%
jan 1, 1985
14.538
+0.061
0.42%
jan 1, 1986
14.588
+0.05
0.34%
jan 1, 1987
14.628
+0.04
0.28%
jan 1, 1988
14.653
+0.025
0.17%
jan 1, 1989
14.66
+0.007
0.05%
jan 1, 1990
14.637
-0.024
-0.16%
jan 1, 1991
14.598
-0.039
-0.27%
jan 1, 1992
14.661
+0.063
0.43%
jan 1, 1993
14.839
+0.177
1.21%
jan 1, 1994
15.019
+0.18
1.21%
jan 1, 1995
15.182
+0.163
1.08%
jan 1, 1996
15.375
+0.194
1.28%
jan 1, 1997
15.57
+0.195
1.27%
jan 1, 1998
15.723
+0.153
0.98%
jan 1, 1999
15.879
+0.155
0.99%
jan 1, 2000
16.032
+0.153
0.96%
jan 1, 2001
16.174
+0.142
0.88%
jan 1, 2002
16.26
+0.087
0.54%
jan 1, 2003
16.301
+0.04
0.25%
jan 1, 2004
16.333
+0.033
0.2%
jan 1, 2005
16.363
+0.03
0.18%
jan 1, 2006
16.391
+0.028
0.17%
jan 1, 2007
16.481
+0.09
0.55%
jan 1, 2008
16.632
+0.151
0.91%
jan 1, 2009
16.778
+0.146
0.88%
jan 1, 2010
16.913
+0.135
0.8%
jan 1, 2011
17.049
+0.137
0.81%
jan 1, 2012
17.204
+0.155
0.91%
jan 1, 2013
17.363
+0.159
0.92%
jan 1, 2014
17.505
+0.142
0.82%
jan 1, 2015
17.622
+0.118
0.67%
jan 1, 2016
17.668
+0.046
0.26%
Ranking of countries by current statistics by years


Comments: