29
/
en
AIzaSyAYiBZKx7MnpbEhh9jyipgxe19OcubqV5w
April 1, 2024
115258
Croatia
HRV
true
2
1
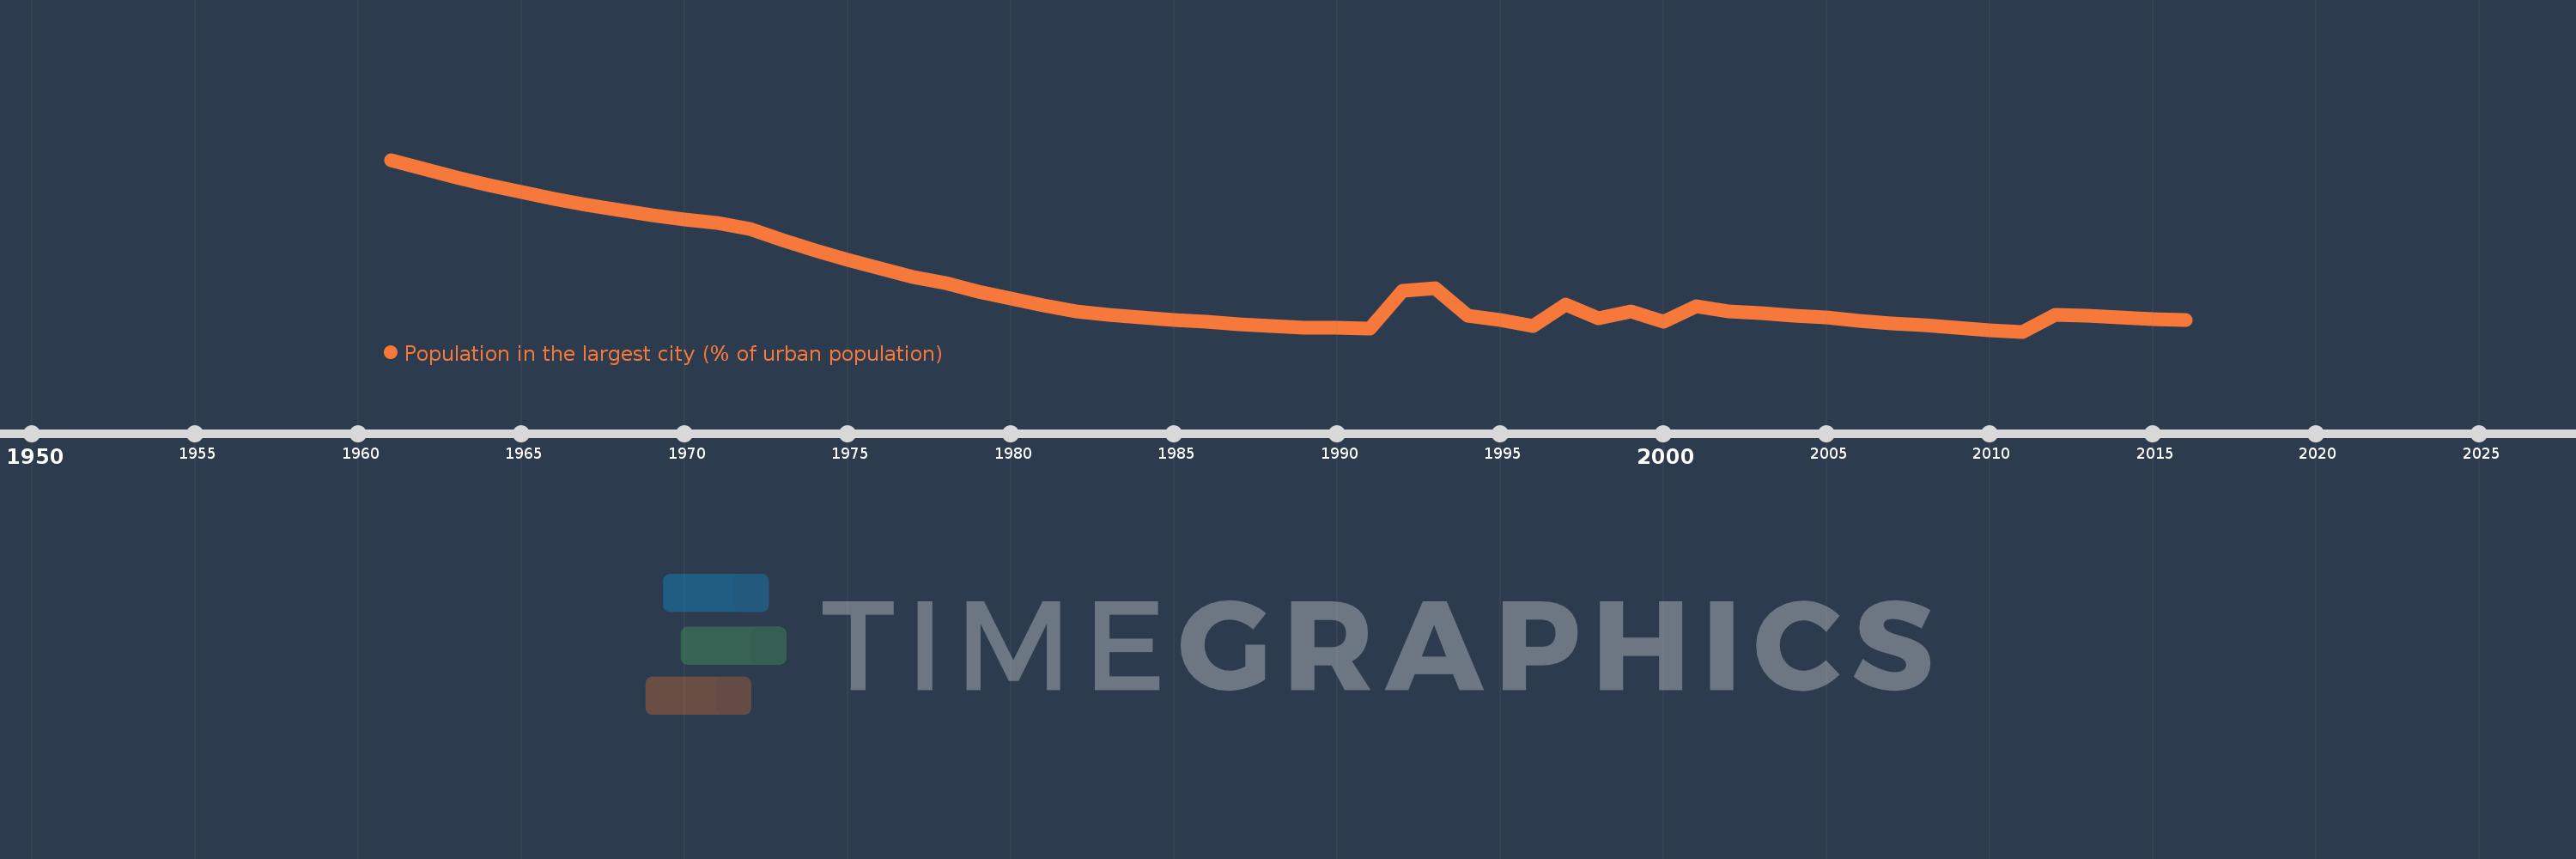
Population in the largest city (% of urban population)
2016,2015,2014,2013,2012,2011,2010,2009,2008,2007,2006,2005,2004,2003,2002,2001,2000,1999,1998,1997,1996,1995,1994,1993,1992,1991,1990,1989,1988,1987,1986,1985,1984,1983,1982,1981,1980,1979,1978,1977,1976,1975,1974,1973,1972,1971,1970,1969,1968,1967,1966,1965,1964,1963,1962,1961
This statistics in other country:
AfghanistanAlbaniaAlgeriaAngolaArab WorldArgentinaArmeniaAustraliaAustriaAzerbaijanBahrainBangladeshBelarusBelgiumBeninBoliviaBosnia and HerzegovinaBrazilBulgariaBurkina FasoBurundiCambodiaCameroonCanadaCentral African RepublicCentral Europe and the BalticsChadChileChinaColombiaCongo, Dem. Rep.Congo, Rep.Costa RicaCote d'IvoireCroatiaCubaCzech RepublicDenmarkDjiboutiDominican RepublicEarly-demographic dividendEast Asia & PacificEast Asia & Pacific (excluding high income)East Asia & Pacific (IDA & IBRD countries)EcuadorEgypt, Arab Rep.El SalvadorEritreaEstoniaEthiopiaEuro areaEurope & Central AsiaEurope & Central Asia (excluding high income)Europe & Central Asia (IDA & IBRD countries)European UnionFinlandFragile and conflict affected situationsFranceGabonGambia, TheGeorgiaGermanyGhanaGreeceGuatemalaGuineaGuinea-BissauHaitiHeavily indebted poor countries (HIPC)High incomeHondurasHong Kong SAR, ChinaHungaryIBRD onlyIDA & IBRD totalIDA blendIDA onlyIDA totalIndiaIndonesiaIran, Islamic Rep.IraqIrelandIsraelItalyJamaicaJapanJordanKazakhstanKenyaKorea, Dem. People’s Rep.Korea, Rep.KuwaitKyrgyz RepublicLao PDRLate-demographic dividendLatin America & Caribbean Latin America & Caribbean (excluding high income)Latin America & the Caribbean (IDA & IBRD countries)LatviaLeast developed countries: UN classificationLebanonLiberiaLibyaLithuaniaLow & middle incomeLow incomeLower middle incomeMacao SAR, ChinaMacedonia, FYRMadagascarMalawiMalaysiaMaliMauritaniaMexicoMiddle East & North AfricaMiddle East & North Africa (excluding high income)Middle East & North Africa (IDA & IBRD countries)Middle incomeMoldovaMongoliaMoroccoMozambiqueMyanmarNamibiaNepalNetherlandsNew ZealandNicaraguaNigerNigeriaNorth AmericaNorwayOECD membersOmanPakistanPanamaPapua New GuineaParaguayPeruPhilippinesPolandPortugalPost-demographic dividendPre-demographic dividendPuerto RicoQatarRomaniaRussian FederationRwandaSaudi ArabiaSenegalSerbiaSierra LeoneSingaporeSlovak RepublicSomaliaSouth AfricaSouth AsiaSouth Asia (IDA & IBRD)South SudanSpainSri LankaSub-Saharan Africa Sub-Saharan Africa (excluding high income)Sub-Saharan Africa (IDA & IBRD countries)SudanSwedenSwitzerlandSyrian Arab RepublicTajikistanTanzaniaThailandTogoTunisiaTurkeyTurkmenistanUgandaUkraineUnited Arab EmiratesUnited KingdomUnited StatesUpper middle incomeUruguayUzbekistanVenezuela, RBVietnamWest Bank and GazaWorldYemen, Rep.ZambiaZimbabwe Timeline:
This timeline shows a graph from 1961 to 2016 of Croatia. No data until 1960. Number of actual observations by date: 56.
Source name:
World Development Indicators
Source organization:
United Nations, World Urbanization Prospects.
Categories, topics:
Urban Development
Last updated:
apr 23, 2017
Indicators value changes by year
Minimum:
27.084
jan 1, 2011
Maximum:
34.421
jan 1, 1961
At the date of observation
Value
Absolute change
Change from previous value
jan 1, 1961
34.421
+34.421
0.0%
jan 1, 1962
34.049
-0.372
-1.08%
jan 1, 1963
33.685
-0.364
-1.07%
jan 1, 1964
33.349
-0.337
-1.0%
jan 1, 1965
33.041
-0.308
-0.92%
jan 1, 1966
32.759
-0.282
-0.85%
jan 1, 1967
32.505
-0.254
-0.77%
jan 1, 1968
32.269
-0.236
-0.73%
jan 1, 1969
32.058
-0.211
-0.65%
jan 1, 1970
31.879
-0.179
-0.56%
jan 1, 1971
31.71
-0.169
-0.53%
jan 1, 1972
31.469
-0.241
-0.76%
jan 1, 1973
31.002
-0.467
-1.48%
jan 1, 1974
30.562
-0.44
-1.42%
jan 1, 1975
30.153
-0.409
-1.34%
jan 1, 1976
29.775
-0.378
-1.26%
jan 1, 1977
29.42
-0.355
-1.19%
jan 1, 1978
29.171
-0.249
-0.85%
jan 1, 1979
28.795
-0.376
-1.29%
jan 1, 1980
28.492
-0.303
-1.05%
jan 1, 1981
28.191
-0.301
-1.06%
jan 1, 1982
27.939
-0.253
-0.9%
jan 1, 1983
27.801
-0.138
-0.49%
jan 1, 1984
27.684
-0.117
-0.42%
jan 1, 1985
27.588
-0.096
-0.35%
jan 1, 1986
27.494
-0.094
-0.34%
jan 1, 1987
27.402
-0.092
-0.33%
jan 1, 1988
27.329
-0.073
-0.26%
jan 1, 1989
27.265
-0.065
-0.24%
jan 1, 1990
27.242
-0.023
-0.08%
jan 1, 1991
27.203
-0.039
-0.14%
jan 1, 1992
28.826
+1.623
5.97%
jan 1, 1993
28.947
+0.121
0.42%
jan 1, 1994
27.756
-1.191
-4.12%
jan 1, 1995
27.566
-0.189
-0.68%
jan 1, 1996
27.326
-0.241
-0.87%
jan 1, 1997
28.257
+0.931
3.41%
jan 1, 1998
27.646
-0.612
-2.16%
jan 1, 1999
27.951
+0.305
1.1%
jan 1, 2000
27.497
-0.454
-1.62%
jan 1, 2001
28.161
+0.664
2.41%
jan 1, 2002
27.954
-0.207
-0.73%
jan 1, 2003
27.864
-0.09
-0.32%
jan 1, 2004
27.768
-0.096
-0.34%
jan 1, 2005
27.673
-0.096
-0.34%
jan 1, 2006
27.547
-0.126
-0.45%
jan 1, 2007
27.447
-0.1
-0.36%
jan 1, 2008
27.354
-0.093
-0.34%
jan 1, 2009
27.241
-0.113
-0.41%
jan 1, 2010
27.147
-0.094
-0.35%
jan 1, 2011
27.084
-0.063
-0.23%
jan 1, 2012
27.81
+0.726
2.68%
jan 1, 2013
27.749
-0.061
-0.22%
jan 1, 2014
27.676
-0.073
-0.26%
jan 1, 2015
27.634
-0.042
-0.15%
jan 1, 2016
27.577
-0.058
-0.21%
Ranking of countries by current statistics by years


Comments: