29
/
en
AIzaSyAYiBZKx7MnpbEhh9jyipgxe19OcubqV5w
April 1, 2024
55082
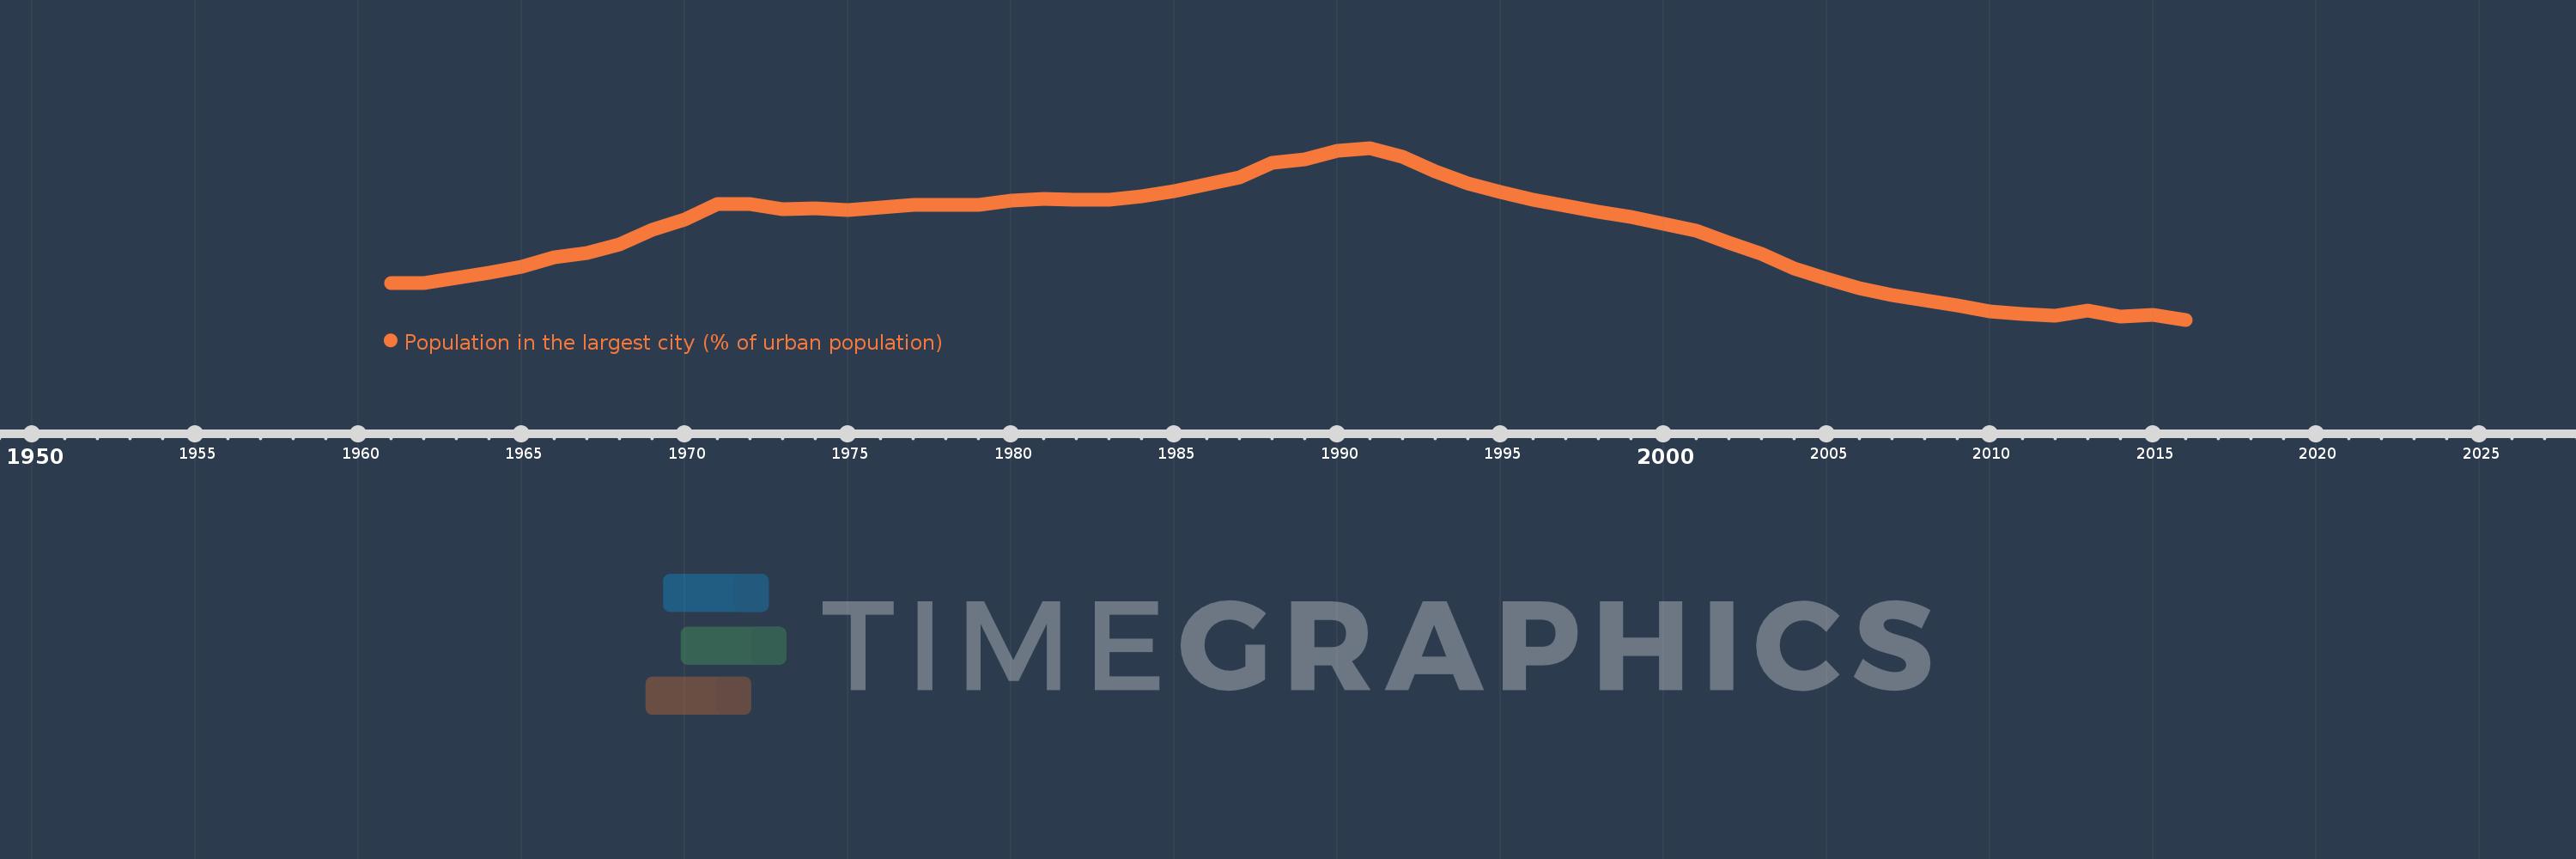
Post-demographic dividend
PST
false
2
1
Population in the largest city (% of urban population)
2016,2015,2014,2013,2012,2011,2010,2009,2008,2007,2006,2005,2004,2003,2002,2001,2000,1999,1998,1997,1996,1995,1994,1993,1992,1991,1990,1989,1988,1987,1986,1985,1984,1983,1982,1981,1980,1979,1978,1977,1976,1975,1974,1973,1972,1971,1970,1969,1968,1967,1966,1965,1964,1963,1962,1961
This statistics in other country:
AfghanistanAlbaniaAlgeriaAngolaArab WorldArgentinaArmeniaAustraliaAustriaAzerbaijanBahrainBangladeshBelarusBelgiumBeninBoliviaBosnia and HerzegovinaBrazilBulgariaBurkina FasoBurundiCambodiaCameroonCanadaCentral African RepublicCentral Europe and the BalticsChadChileChinaColombiaCongo, Dem. Rep.Congo, Rep.Costa RicaCote d'IvoireCroatiaCubaCzech RepublicDenmarkDjiboutiDominican RepublicEarly-demographic dividendEast Asia & PacificEast Asia & Pacific (excluding high income)East Asia & Pacific (IDA & IBRD countries)EcuadorEgypt, Arab Rep.El SalvadorEritreaEstoniaEthiopiaEuro areaEurope & Central AsiaEurope & Central Asia (excluding high income)Europe & Central Asia (IDA & IBRD countries)European UnionFinlandFragile and conflict affected situationsFranceGabonGambia, TheGeorgiaGermanyGhanaGreeceGuatemalaGuineaGuinea-BissauHaitiHeavily indebted poor countries (HIPC)High incomeHondurasHong Kong SAR, ChinaHungaryIBRD onlyIDA & IBRD totalIDA blendIDA onlyIDA totalIndiaIndonesiaIran, Islamic Rep.IraqIrelandIsraelItalyJamaicaJapanJordanKazakhstanKenyaKorea, Dem. People’s Rep.Korea, Rep.KuwaitKyrgyz RepublicLao PDRLate-demographic dividendLatin America & Caribbean Latin America & Caribbean (excluding high income)Latin America & the Caribbean (IDA & IBRD countries)LatviaLeast developed countries: UN classificationLebanonLiberiaLibyaLithuaniaLow & middle incomeLow incomeLower middle incomeMacao SAR, ChinaMacedonia, FYRMadagascarMalawiMalaysiaMaliMauritaniaMexicoMiddle East & North AfricaMiddle East & North Africa (excluding high income)Middle East & North Africa (IDA & IBRD countries)Middle incomeMoldovaMongoliaMoroccoMozambiqueMyanmarNamibiaNepalNetherlandsNew ZealandNicaraguaNigerNigeriaNorth AmericaNorwayOECD membersOmanPakistanPanamaPapua New GuineaParaguayPeruPhilippinesPolandPortugalPost-demographic dividendPre-demographic dividendPuerto RicoQatarRomaniaRussian FederationRwandaSaudi ArabiaSenegalSerbiaSierra LeoneSingaporeSlovak RepublicSomaliaSouth AfricaSouth AsiaSouth Asia (IDA & IBRD)South SudanSpainSri LankaSub-Saharan Africa Sub-Saharan Africa (excluding high income)Sub-Saharan Africa (IDA & IBRD countries)SudanSwedenSwitzerlandSyrian Arab RepublicTajikistanTanzaniaThailandTogoTunisiaTurkeyTurkmenistanUgandaUkraineUnited Arab EmiratesUnited KingdomUnited StatesUpper middle incomeUruguayUzbekistanVenezuela, RBVietnamWest Bank and GazaWorldYemen, Rep.ZambiaZimbabwe Timeline:
This timeline shows a graph from 1961 to 2016 of Post-demographic dividend. No data until 1960. Number of actual observations by date: 56.
Source name:
World Development Indicators
Source organization:
United Nations, World Urbanization Prospects.
Categories, topics:
Urban Development
Last updated:
apr 23, 2017
Indicators value changes by year
Minimum:
17.595
jan 1, 2016
Maximum:
18.512
jan 1, 1991
At the date of observation
Value
Absolute change
Change from previous value
jan 1, 1961
17.79
+17.79
0.0%
jan 1, 1962
17.789
-0.001
-0.01%
jan 1, 1963
17.82
+0.032
0.18%
jan 1, 1964
17.846
+0.025
0.14%
jan 1, 1965
17.879
+0.033
0.19%
jan 1, 1966
17.928
+0.049
0.27%
jan 1, 1967
17.949
+0.021
0.12%
jan 1, 1968
17.995
+0.046
0.25%
jan 1, 1969
18.076
+0.081
0.45%
jan 1, 1970
18.132
+0.056
0.31%
jan 1, 1971
18.213
+0.081
0.45%
jan 1, 1972
18.214
+0.001
0.0%
jan 1, 1973
18.186
-0.027
-0.15%
jan 1, 1974
18.191
+0.005
0.03%
jan 1, 1975
18.182
-0.009
-0.05%
jan 1, 1976
18.193
+0.011
0.06%
jan 1, 1977
18.208
+0.015
0.08%
jan 1, 1978
18.208
0.0
0.0%
jan 1, 1979
18.207
-0.001
-0.01%
jan 1, 1980
18.229
+0.023
0.12%
jan 1, 1981
18.242
+0.013
0.07%
jan 1, 1982
18.236
-0.007
-0.04%
jan 1, 1983
18.235
-0.001
0.0%
jan 1, 1984
18.252
+0.018
0.1%
jan 1, 1985
18.283
+0.03
0.17%
jan 1, 1986
18.318
+0.035
0.19%
jan 1, 1987
18.354
+0.036
0.2%
jan 1, 1988
18.433
+0.079
0.43%
jan 1, 1989
18.452
+0.018
0.1%
jan 1, 1990
18.497
+0.045
0.24%
jan 1, 1991
18.512
+0.015
0.08%
jan 1, 1992
18.465
-0.047
-0.25%
jan 1, 1993
18.386
-0.079
-0.43%
jan 1, 1994
18.322
-0.064
-0.35%
jan 1, 1995
18.278
-0.044
-0.24%
jan 1, 1996
18.237
-0.041
-0.22%
jan 1, 1997
18.202
-0.036
-0.19%
jan 1, 1998
18.172
-0.03
-0.16%
jan 1, 1999
18.142
-0.03
-0.16%
jan 1, 2000
18.108
-0.035
-0.19%
jan 1, 2001
18.072
-0.036
-0.2%
jan 1, 2002
18.007
-0.064
-0.36%
jan 1, 2003
17.947
-0.061
-0.34%
jan 1, 2004
17.871
-0.076
-0.42%
jan 1, 2005
17.813
-0.058
-0.32%
jan 1, 2006
17.765
-0.048
-0.27%
jan 1, 2007
17.728
-0.037
-0.21%
jan 1, 2008
17.7
-0.029
-0.16%
jan 1, 2009
17.67
-0.03
-0.17%
jan 1, 2010
17.641
-0.029
-0.16%
jan 1, 2011
17.625
-0.016
-0.09%
jan 1, 2012
17.618
-0.006
-0.04%
jan 1, 2013
17.642
+0.024
0.13%
jan 1, 2014
17.612
-0.03
-0.17%
jan 1, 2015
17.621
+0.009
0.05%
jan 1, 2016
17.595
-0.026
-0.15%
Ranking of countries by current statistics by years


Comments: