29
/
en
AIzaSyAYiBZKx7MnpbEhh9jyipgxe19OcubqV5w
April 1, 2024
257696
Switzerland
CHE
true
2
1
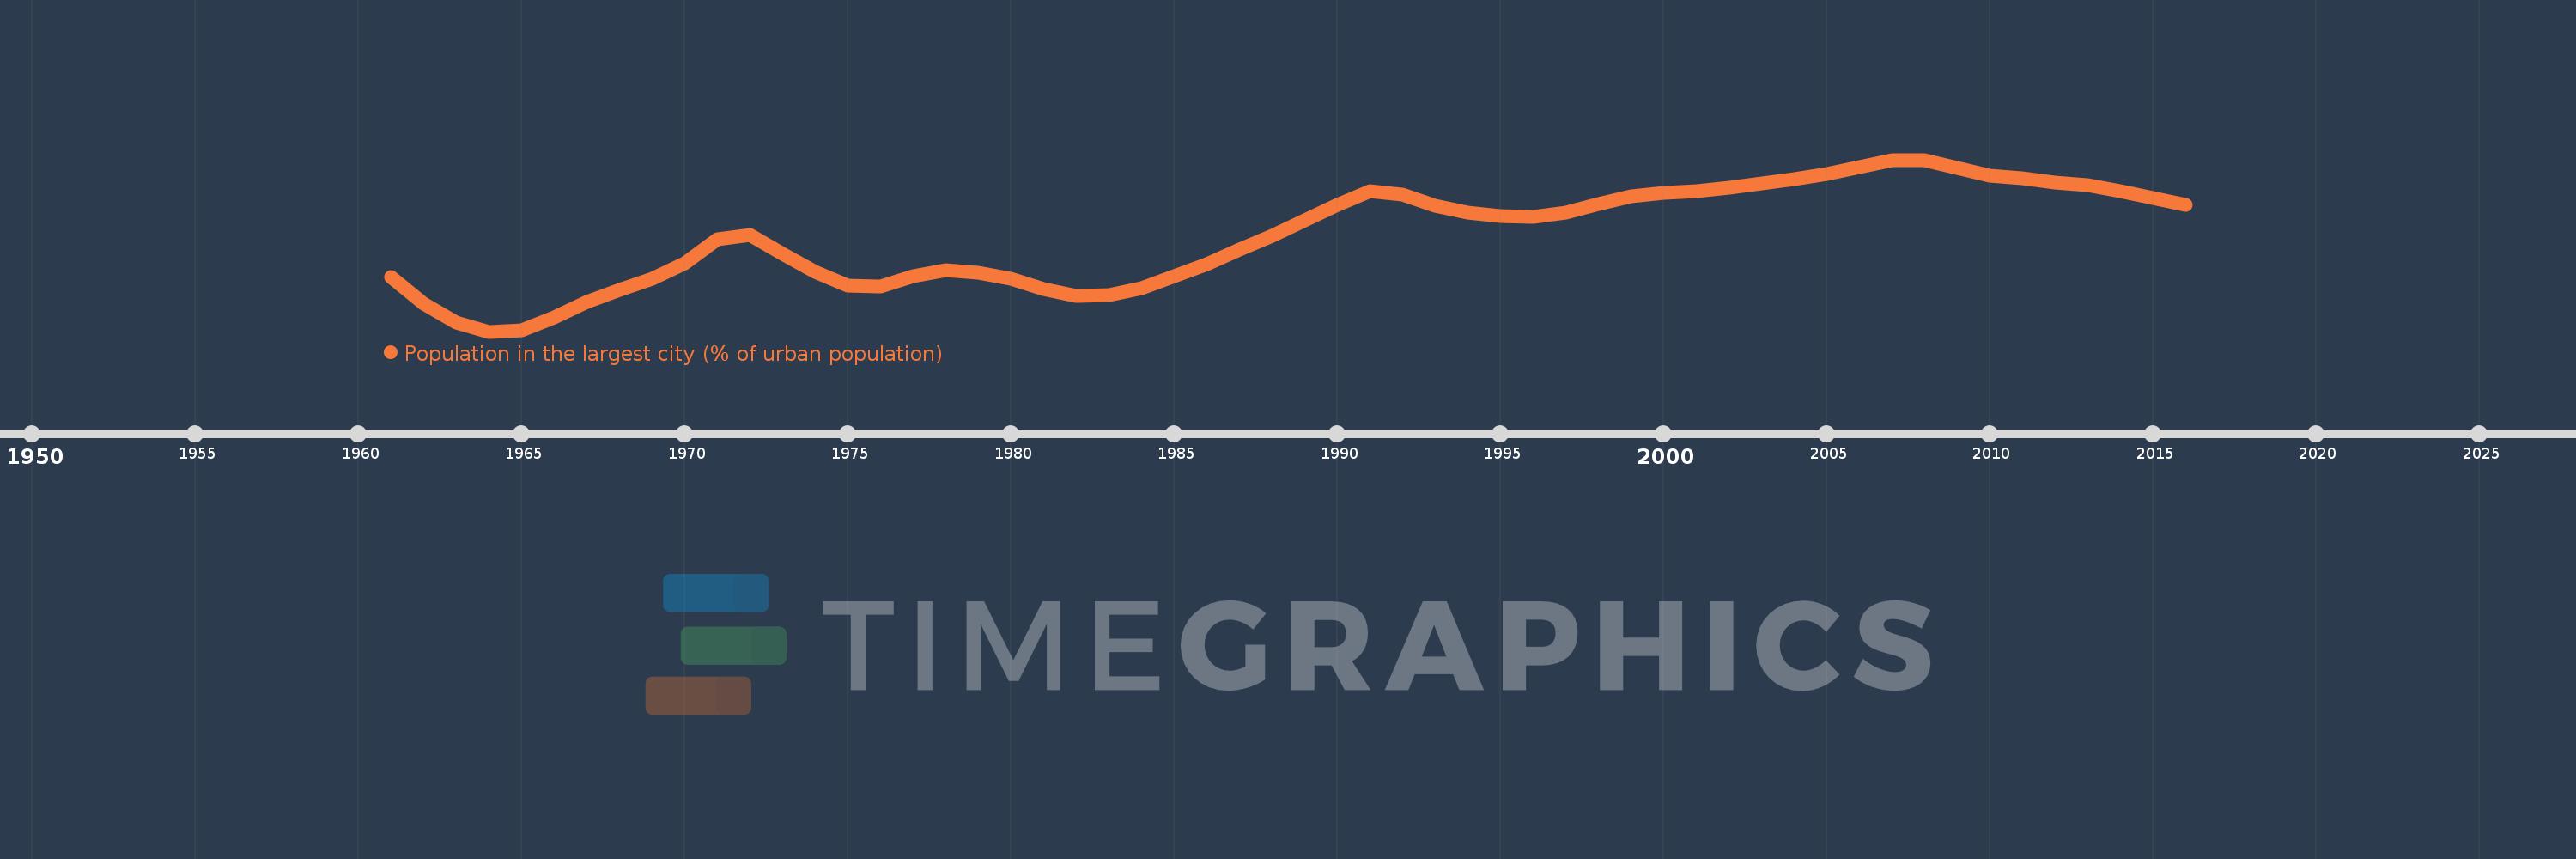
Population in the largest city (% of urban population)
2016,2015,2014,2013,2012,2011,2010,2009,2008,2007,2006,2005,2004,2003,2002,2001,2000,1999,1998,1997,1996,1995,1994,1993,1992,1991,1990,1989,1988,1987,1986,1985,1984,1983,1982,1981,1980,1979,1978,1977,1976,1975,1974,1973,1972,1971,1970,1969,1968,1967,1966,1965,1964,1963,1962,1961
This statistics in other country:
AfghanistanAlbaniaAlgeriaAngolaArab WorldArgentinaArmeniaAustraliaAustriaAzerbaijanBahrainBangladeshBelarusBelgiumBeninBoliviaBosnia and HerzegovinaBrazilBulgariaBurkina FasoBurundiCambodiaCameroonCanadaCentral African RepublicCentral Europe and the BalticsChadChileChinaColombiaCongo, Dem. Rep.Congo, Rep.Costa RicaCote d'IvoireCroatiaCubaCzech RepublicDenmarkDjiboutiDominican RepublicEarly-demographic dividendEast Asia & PacificEast Asia & Pacific (excluding high income)East Asia & Pacific (IDA & IBRD countries)EcuadorEgypt, Arab Rep.El SalvadorEritreaEstoniaEthiopiaEuro areaEurope & Central AsiaEurope & Central Asia (excluding high income)Europe & Central Asia (IDA & IBRD countries)European UnionFinlandFragile and conflict affected situationsFranceGabonGambia, TheGeorgiaGermanyGhanaGreeceGuatemalaGuineaGuinea-BissauHaitiHeavily indebted poor countries (HIPC)High incomeHondurasHong Kong SAR, ChinaHungaryIBRD onlyIDA & IBRD totalIDA blendIDA onlyIDA totalIndiaIndonesiaIran, Islamic Rep.IraqIrelandIsraelItalyJamaicaJapanJordanKazakhstanKenyaKorea, Dem. People’s Rep.Korea, Rep.KuwaitKyrgyz RepublicLao PDRLate-demographic dividendLatin America & Caribbean Latin America & Caribbean (excluding high income)Latin America & the Caribbean (IDA & IBRD countries)LatviaLeast developed countries: UN classificationLebanonLiberiaLibyaLithuaniaLow & middle incomeLow incomeLower middle incomeMacao SAR, ChinaMacedonia, FYRMadagascarMalawiMalaysiaMaliMauritaniaMexicoMiddle East & North AfricaMiddle East & North Africa (excluding high income)Middle East & North Africa (IDA & IBRD countries)Middle incomeMoldovaMongoliaMoroccoMozambiqueMyanmarNamibiaNepalNetherlandsNew ZealandNicaraguaNigerNigeriaNorth AmericaNorwayOECD membersOmanPakistanPanamaPapua New GuineaParaguayPeruPhilippinesPolandPortugalPost-demographic dividendPre-demographic dividendPuerto RicoQatarRomaniaRussian FederationRwandaSaudi ArabiaSenegalSerbiaSierra LeoneSingaporeSlovak RepublicSomaliaSouth AfricaSouth AsiaSouth Asia (IDA & IBRD)South SudanSpainSri LankaSub-Saharan Africa Sub-Saharan Africa (excluding high income)Sub-Saharan Africa (IDA & IBRD countries)SudanSwedenSwitzerlandSyrian Arab RepublicTajikistanTanzaniaThailandTogoTunisiaTurkeyTurkmenistanUgandaUkraineUnited Arab EmiratesUnited KingdomUnited StatesUpper middle incomeUruguayUzbekistanVenezuela, RBVietnamWest Bank and GazaWorldYemen, Rep.ZambiaZimbabwe Timeline:
This timeline shows a graph from 1961 to 2016 of Switzerland. No data until 1960. Number of actual observations by date: 56.
Source name:
World Development Indicators
Source organization:
United Nations, World Urbanization Prospects.
Categories, topics:
Urban Development
Last updated:
apr 23, 2017
Indicators value changes by year
Minimum:
19.215
jan 1, 1964
Maximum:
20.747
jan 1, 2008
At the date of observation
Value
Absolute change
Change from previous value
jan 1, 1961
19.699
+19.699
0.0%
jan 1, 1962
19.462
-0.238
-1.21%
jan 1, 1963
19.298
-0.164
-0.84%
jan 1, 1964
19.215
-0.083
-0.43%
jan 1, 1965
19.229
+0.014
0.07%
jan 1, 1966
19.341
+0.112
0.58%
jan 1, 1967
19.479
+0.138
0.71%
jan 1, 1968
19.583
+0.104
0.53%
jan 1, 1969
19.688
+0.104
0.53%
jan 1, 1970
19.821
+0.133
0.68%
jan 1, 1971
20.04
+0.219
1.1%
jan 1, 1972
20.079
+0.039
0.19%
jan 1, 1973
19.909
-0.169
-0.84%
jan 1, 1974
19.746
-0.163
-0.82%
jan 1, 1975
19.623
-0.123
-0.62%
jan 1, 1976
19.615
-0.008
-0.04%
jan 1, 1977
19.711
+0.096
0.49%
jan 1, 1978
19.761
+0.05
0.26%
jan 1, 1979
19.743
-0.018
-0.09%
jan 1, 1980
19.687
-0.056
-0.28%
jan 1, 1981
19.592
-0.095
-0.48%
jan 1, 1982
19.536
-0.057
-0.29%
jan 1, 1983
19.541
+0.006
0.03%
jan 1, 1984
19.604
+0.063
0.32%
jan 1, 1985
19.707
+0.103
0.53%
jan 1, 1986
19.82
+0.113
0.57%
jan 1, 1987
19.944
+0.123
0.62%
jan 1, 1988
20.072
+0.128
0.64%
jan 1, 1989
20.204
+0.132
0.66%
jan 1, 1990
20.345
+0.141
0.7%
jan 1, 1991
20.466
+0.121
0.6%
jan 1, 1992
20.433
-0.033
-0.16%
jan 1, 1993
20.337
-0.096
-0.47%
jan 1, 1994
20.279
-0.057
-0.28%
jan 1, 1995
20.245
-0.034
-0.17%
jan 1, 1996
20.237
-0.008
-0.04%
jan 1, 1997
20.275
+0.038
0.19%
jan 1, 1998
20.354
+0.079
0.39%
jan 1, 1999
20.422
+0.068
0.33%
jan 1, 2000
20.453
+0.031
0.15%
jan 1, 2001
20.467
+0.014
0.07%
jan 1, 2002
20.501
+0.033
0.16%
jan 1, 2003
20.535
+0.034
0.17%
jan 1, 2004
20.572
+0.037
0.18%
jan 1, 2005
20.621
+0.049
0.24%
jan 1, 2006
20.68
+0.058
0.28%
jan 1, 2007
20.741
+0.061
0.3%
jan 1, 2008
20.747
+0.006
0.03%
jan 1, 2009
20.676
-0.072
-0.34%
jan 1, 2010
20.608
-0.067
-0.32%
jan 1, 2011
20.584
-0.024
-0.12%
jan 1, 2012
20.546
-0.039
-0.19%
jan 1, 2013
20.518
-0.028
-0.14%
jan 1, 2014
20.469
-0.049
-0.24%
jan 1, 2015
20.403
-0.065
-0.32%
jan 1, 2016
20.346
-0.058
-0.28%
Ranking of countries by current statistics by years


Comments: