29
/
en
AIzaSyAYiBZKx7MnpbEhh9jyipgxe19OcubqV5w
April 1, 2024
231532
Rwanda
RWA
true
2
1
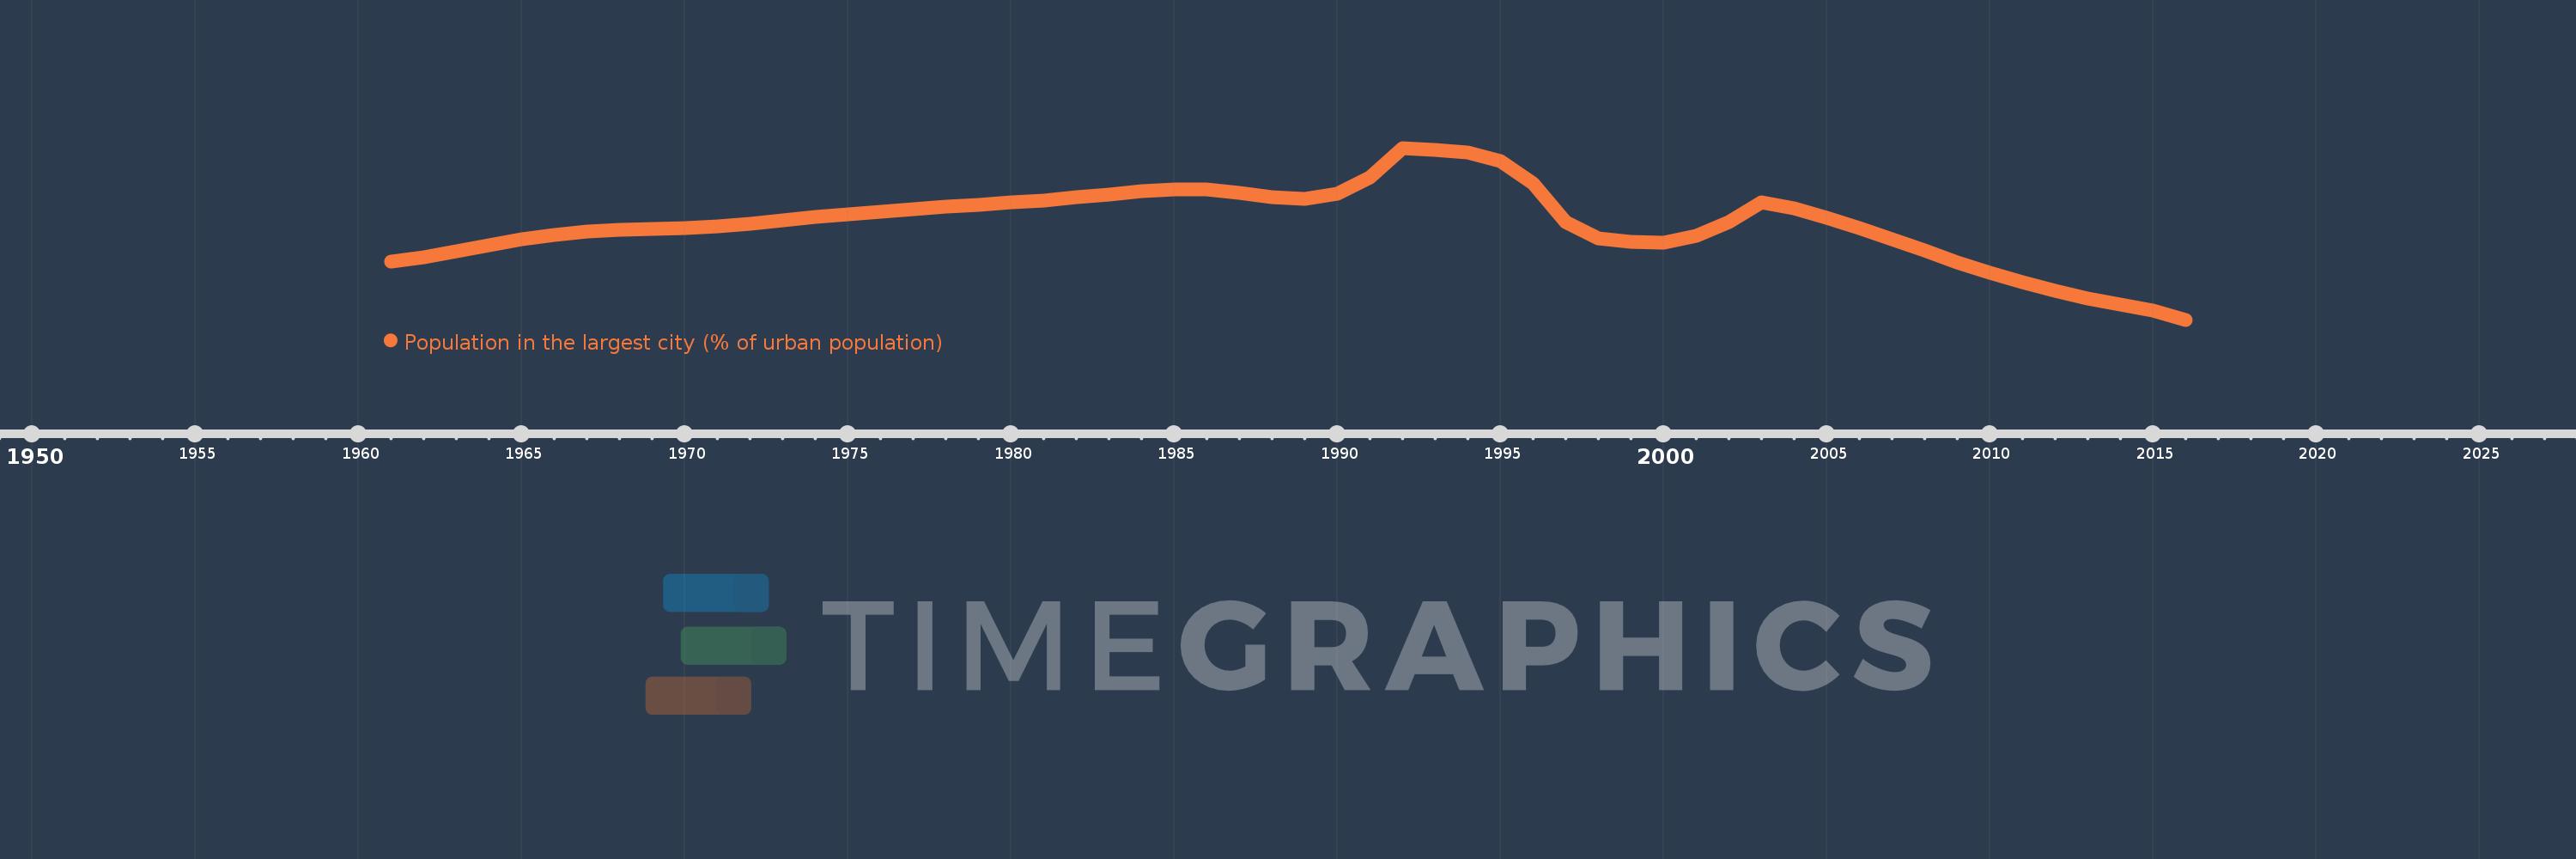
Population in the largest city (% of urban population)
2016,2015,2014,2013,2012,2011,2010,2009,2008,2007,2006,2005,2004,2003,2002,2001,2000,1999,1998,1997,1996,1995,1994,1993,1992,1991,1990,1989,1988,1987,1986,1985,1984,1983,1982,1981,1980,1979,1978,1977,1976,1975,1974,1973,1972,1971,1970,1969,1968,1967,1966,1965,1964,1963,1962,1961
This statistics in other country:
AfghanistanAlbaniaAlgeriaAngolaArab WorldArgentinaArmeniaAustraliaAustriaAzerbaijanBahrainBangladeshBelarusBelgiumBeninBoliviaBosnia and HerzegovinaBrazilBulgariaBurkina FasoBurundiCambodiaCameroonCanadaCentral African RepublicCentral Europe and the BalticsChadChileChinaColombiaCongo, Dem. Rep.Congo, Rep.Costa RicaCote d'IvoireCroatiaCubaCzech RepublicDenmarkDjiboutiDominican RepublicEarly-demographic dividendEast Asia & PacificEast Asia & Pacific (excluding high income)East Asia & Pacific (IDA & IBRD countries)EcuadorEgypt, Arab Rep.El SalvadorEritreaEstoniaEthiopiaEuro areaEurope & Central AsiaEurope & Central Asia (excluding high income)Europe & Central Asia (IDA & IBRD countries)European UnionFinlandFragile and conflict affected situationsFranceGabonGambia, TheGeorgiaGermanyGhanaGreeceGuatemalaGuineaGuinea-BissauHaitiHeavily indebted poor countries (HIPC)High incomeHondurasHong Kong SAR, ChinaHungaryIBRD onlyIDA & IBRD totalIDA blendIDA onlyIDA totalIndiaIndonesiaIran, Islamic Rep.IraqIrelandIsraelItalyJamaicaJapanJordanKazakhstanKenyaKorea, Dem. People’s Rep.Korea, Rep.KuwaitKyrgyz RepublicLao PDRLate-demographic dividendLatin America & Caribbean Latin America & Caribbean (excluding high income)Latin America & the Caribbean (IDA & IBRD countries)LatviaLeast developed countries: UN classificationLebanonLiberiaLibyaLithuaniaLow & middle incomeLow incomeLower middle incomeMacao SAR, ChinaMacedonia, FYRMadagascarMalawiMalaysiaMaliMauritaniaMexicoMiddle East & North AfricaMiddle East & North Africa (excluding high income)Middle East & North Africa (IDA & IBRD countries)Middle incomeMoldovaMongoliaMoroccoMozambiqueMyanmarNamibiaNepalNetherlandsNew ZealandNicaraguaNigerNigeriaNorth AmericaNorwayOECD membersOmanPakistanPanamaPapua New GuineaParaguayPeruPhilippinesPolandPortugalPost-demographic dividendPre-demographic dividendPuerto RicoQatarRomaniaRussian FederationRwandaSaudi ArabiaSenegalSerbiaSierra LeoneSingaporeSlovak RepublicSomaliaSouth AfricaSouth AsiaSouth Asia (IDA & IBRD)South SudanSpainSri LankaSub-Saharan Africa Sub-Saharan Africa (excluding high income)Sub-Saharan Africa (IDA & IBRD countries)SudanSwedenSwitzerlandSyrian Arab RepublicTajikistanTanzaniaThailandTogoTunisiaTurkeyTurkmenistanUgandaUkraineUnited Arab EmiratesUnited KingdomUnited StatesUpper middle incomeUruguayUzbekistanVenezuela, RBVietnamWest Bank and GazaWorldYemen, Rep.ZambiaZimbabwe Timeline:
This timeline shows a graph from 1961 to 2016 of Rwanda. No data until 1960. Number of actual observations by date: 56.
Source name:
World Development Indicators
Source organization:
United Nations, World Urbanization Prospects.
Categories, topics:
Urban Development
Last updated:
apr 23, 2017
Indicators value changes by year
Maximum:
59.543
jan 1, 1992
At the date of observation
Value
Absolute change
Change from previous value
jan 1, 1961
44.997
+44.997
0.0%
jan 1, 1962
45.59
+0.592
1.32%
jan 1, 1963
46.322
+0.733
1.61%
jan 1, 1964
47.133
+0.81
1.75%
jan 1, 1965
47.865
+0.732
1.55%
jan 1, 1966
48.451
+0.586
1.22%
jan 1, 1967
48.837
+0.386
0.8%
jan 1, 1968
49.076
+0.238
0.49%
jan 1, 1969
49.211
+0.136
0.28%
jan 1, 1970
49.35
+0.139
0.28%
jan 1, 1971
49.521
+0.171
0.35%
jan 1, 1972
49.867
+0.346
0.7%
jan 1, 1973
50.269
+0.402
0.81%
jan 1, 1974
50.681
+0.412
0.82%
jan 1, 1975
51.066
+0.385
0.76%
jan 1, 1976
51.404
+0.338
0.66%
jan 1, 1977
51.718
+0.314
0.61%
jan 1, 1978
51.99
+0.273
0.53%
jan 1, 1979
52.235
+0.245
0.47%
jan 1, 1980
52.549
+0.314
0.6%
jan 1, 1981
52.85
+0.301
0.57%
jan 1, 1982
53.206
+0.355
0.67%
jan 1, 1983
53.618
+0.412
0.77%
jan 1, 1984
53.999
+0.381
0.71%
jan 1, 1985
54.206
+0.207
0.38%
jan 1, 1986
54.188
-0.018
-0.03%
jan 1, 1987
53.815
-0.373
-0.69%
jan 1, 1988
53.246
-0.57
-1.06%
jan 1, 1989
53.009
-0.237
-0.44%
jan 1, 1990
53.712
+0.704
1.33%
jan 1, 1991
55.735
+2.022
3.77%
jan 1, 1992
59.543
+3.809
6.83%
jan 1, 1993
59.257
-0.286
-0.48%
jan 1, 1994
58.926
-0.331
-0.56%
jan 1, 1995
57.897
-1.029
-1.75%
jan 1, 1996
55.008
-2.889
-4.99%
jan 1, 1997
50.084
-4.923
-8.95%
jan 1, 1998
47.959
-2.125
-4.24%
jan 1, 1999
47.558
-0.401
-0.84%
jan 1, 2000
47.482
-0.076
-0.16%
jan 1, 2001
48.284
+0.802
1.69%
jan 1, 2002
50.03
+1.746
3.62%
jan 1, 2003
52.541
+2.511
5.02%
jan 1, 2004
51.822
-0.719
-1.37%
jan 1, 2005
50.657
-1.165
-2.25%
jan 1, 2006
49.351
-1.306
-2.58%
jan 1, 2007
47.897
-1.454
-2.95%
jan 1, 2008
46.401
-1.496
-3.12%
jan 1, 2009
44.918
-1.483
-3.2%
jan 1, 2010
43.557
-1.361
-3.03%
jan 1, 2011
42.35
-1.207
-2.77%
jan 1, 2012
41.285
-1.064
-2.51%
jan 1, 2013
40.34
-0.946
-2.29%
jan 1, 2014
39.486
-0.853
-2.12%
jan 1, 2015
38.718
-0.768
-1.94%
jan 1, 2016
37.58
-1.139
-2.94%
Ranking of countries by current statistics by years


Comments: