29
/
en
AIzaSyAYiBZKx7MnpbEhh9jyipgxe19OcubqV5w
April 1, 2024
258792
Syrian Arab Republic
SYR
true
2
1
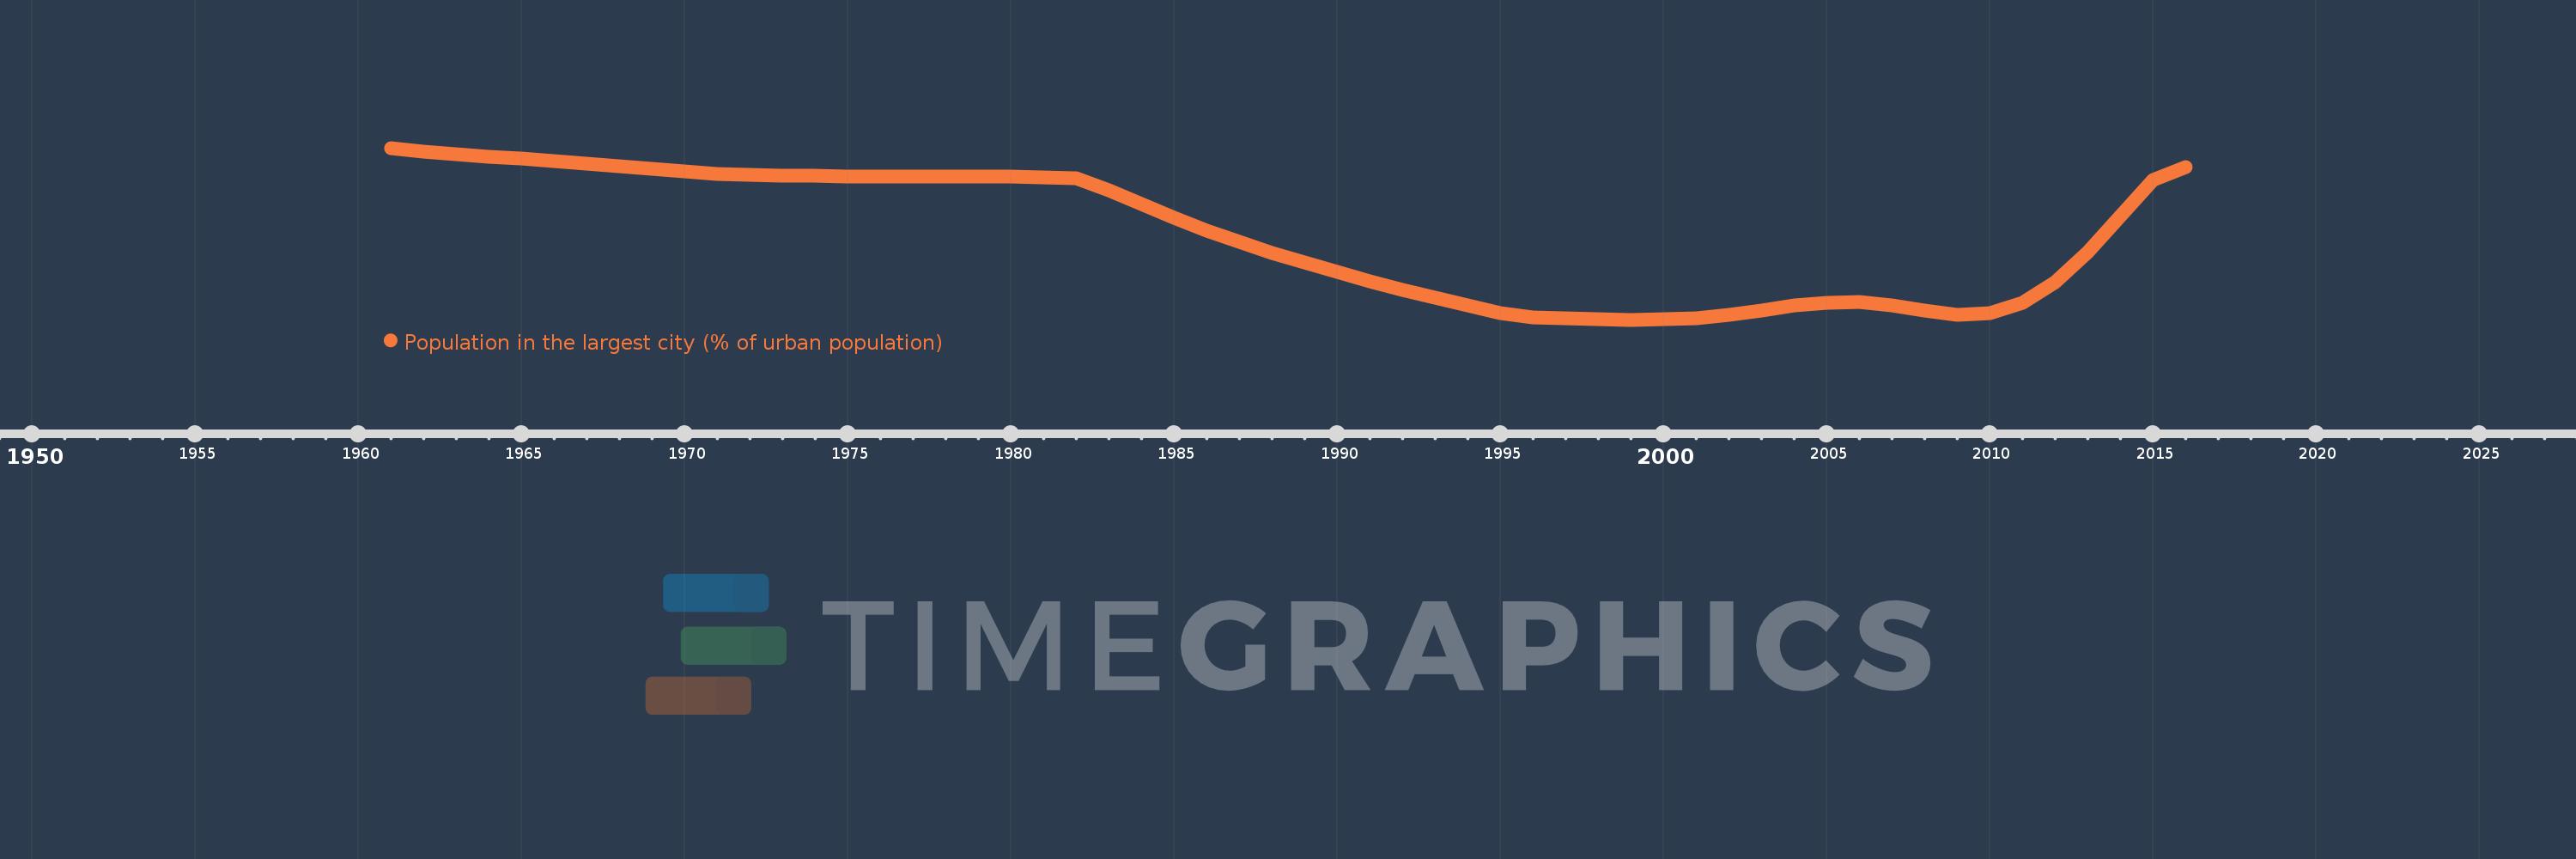
Population in the largest city (% of urban population)
2016,2015,2014,2013,2012,2011,2010,2009,2008,2007,2006,2005,2004,2003,2002,2001,2000,1999,1998,1997,1996,1995,1994,1993,1992,1991,1990,1989,1988,1987,1986,1985,1984,1983,1982,1981,1980,1979,1978,1977,1976,1975,1974,1973,1972,1971,1970,1969,1968,1967,1966,1965,1964,1963,1962,1961
This statistics in other country:
AfghanistanAlbaniaAlgeriaAngolaArab WorldArgentinaArmeniaAustraliaAustriaAzerbaijanBahrainBangladeshBelarusBelgiumBeninBoliviaBosnia and HerzegovinaBrazilBulgariaBurkina FasoBurundiCambodiaCameroonCanadaCentral African RepublicCentral Europe and the BalticsChadChileChinaColombiaCongo, Dem. Rep.Congo, Rep.Costa RicaCote d'IvoireCroatiaCubaCzech RepublicDenmarkDjiboutiDominican RepublicEarly-demographic dividendEast Asia & PacificEast Asia & Pacific (excluding high income)East Asia & Pacific (IDA & IBRD countries)EcuadorEgypt, Arab Rep.El SalvadorEritreaEstoniaEthiopiaEuro areaEurope & Central AsiaEurope & Central Asia (excluding high income)Europe & Central Asia (IDA & IBRD countries)European UnionFinlandFragile and conflict affected situationsFranceGabonGambia, TheGeorgiaGermanyGhanaGreeceGuatemalaGuineaGuinea-BissauHaitiHeavily indebted poor countries (HIPC)High incomeHondurasHong Kong SAR, ChinaHungaryIBRD onlyIDA & IBRD totalIDA blendIDA onlyIDA totalIndiaIndonesiaIran, Islamic Rep.IraqIrelandIsraelItalyJamaicaJapanJordanKazakhstanKenyaKorea, Dem. People’s Rep.Korea, Rep.KuwaitKyrgyz RepublicLao PDRLate-demographic dividendLatin America & Caribbean Latin America & Caribbean (excluding high income)Latin America & the Caribbean (IDA & IBRD countries)LatviaLeast developed countries: UN classificationLebanonLiberiaLibyaLithuaniaLow & middle incomeLow incomeLower middle incomeMacao SAR, ChinaMacedonia, FYRMadagascarMalawiMalaysiaMaliMauritaniaMexicoMiddle East & North AfricaMiddle East & North Africa (excluding high income)Middle East & North Africa (IDA & IBRD countries)Middle incomeMoldovaMongoliaMoroccoMozambiqueMyanmarNamibiaNepalNetherlandsNew ZealandNicaraguaNigerNigeriaNorth AmericaNorwayOECD membersOmanPakistanPanamaPapua New GuineaParaguayPeruPhilippinesPolandPortugalPost-demographic dividendPre-demographic dividendPuerto RicoQatarRomaniaRussian FederationRwandaSaudi ArabiaSenegalSerbiaSierra LeoneSingaporeSlovak RepublicSomaliaSouth AfricaSouth AsiaSouth Asia (IDA & IBRD)South SudanSpainSri LankaSub-Saharan Africa Sub-Saharan Africa (excluding high income)Sub-Saharan Africa (IDA & IBRD countries)SudanSwedenSwitzerlandSyrian Arab RepublicTajikistanTanzaniaThailandTogoTunisiaTurkeyTurkmenistanUgandaUkraineUnited Arab EmiratesUnited KingdomUnited StatesUpper middle incomeUruguayUzbekistanVenezuela, RBVietnamWest Bank and GazaWorldYemen, Rep.ZambiaZimbabwe Timeline:
This timeline shows a graph from 1961 to 2016 of Syrian Arab Republic. No data until 1960. Number of actual observations by date: 56.
Source name:
World Development Indicators
Source organization:
United Nations, World Urbanization Prospects.
Categories, topics:
Urban Development
Last updated:
apr 23, 2017
Indicators value changes by year
Minimum:
25.849
jan 1, 1999
Maximum:
34.338
jan 1, 1961
At the date of observation
Value
Absolute change
Change from previous value
jan 1, 1961
34.338
+34.338
0.0%
jan 1, 1962
34.162
-0.176
-0.51%
jan 1, 1963
34.039
-0.123
-0.36%
jan 1, 1964
33.919
-0.12
-0.35%
jan 1, 1965
33.799
-0.12
-0.35%
jan 1, 1966
33.674
-0.125
-0.37%
jan 1, 1967
33.549
-0.125
-0.37%
jan 1, 1968
33.423
-0.126
-0.38%
jan 1, 1969
33.298
-0.125
-0.37%
jan 1, 1970
33.17
-0.128
-0.38%
jan 1, 1971
33.043
-0.127
-0.38%
jan 1, 1972
32.998
-0.046
-0.14%
jan 1, 1973
32.974
-0.024
-0.07%
jan 1, 1974
32.946
-0.027
-0.08%
jan 1, 1975
32.925
-0.021
-0.06%
jan 1, 1976
32.912
-0.013
-0.04%
jan 1, 1977
32.912
0.0
0.0%
jan 1, 1978
32.918
+0.006
0.02%
jan 1, 1979
32.924
+0.006
0.02%
jan 1, 1980
32.917
-0.007
-0.02%
jan 1, 1981
32.892
-0.026
-0.08%
jan 1, 1982
32.843
-0.049
-0.15%
jan 1, 1983
32.249
-0.594
-1.81%
jan 1, 1984
31.547
-0.701
-2.18%
jan 1, 1985
30.884
-0.663
-2.1%
jan 1, 1986
30.267
-0.617
-2.0%
jan 1, 1987
29.696
-0.571
-1.89%
jan 1, 1988
29.165
-0.531
-1.79%
jan 1, 1989
28.669
-0.496
-1.7%
jan 1, 1990
28.199
-0.47
-1.64%
jan 1, 1991
27.753
-0.446
-1.58%
jan 1, 1992
27.331
-0.422
-1.52%
jan 1, 1993
26.933
-0.398
-1.46%
jan 1, 1994
26.552
-0.382
-1.42%
jan 1, 1995
26.181
-0.371
-1.4%
jan 1, 1996
25.959
-0.222
-0.85%
jan 1, 1997
25.916
-0.043
-0.16%
jan 1, 1998
25.873
-0.043
-0.17%
jan 1, 1999
25.849
-0.024
-0.09%
jan 1, 2000
25.868
+0.018
0.07%
jan 1, 2001
25.939
+0.072
0.28%
jan 1, 2002
26.09
+0.15
0.58%
jan 1, 2003
26.311
+0.222
0.85%
jan 1, 2004
26.539
+0.228
0.87%
jan 1, 2005
26.687
+0.148
0.56%
jan 1, 2006
26.71
+0.022
0.08%
jan 1, 2007
26.556
-0.154
-0.57%
jan 1, 2008
26.291
-0.266
-1.0%
jan 1, 2009
26.094
-0.196
-0.75%
jan 1, 2010
26.183
+0.088
0.34%
jan 1, 2011
26.685
+0.502
1.92%
jan 1, 2012
27.693
+1.009
3.78%
jan 1, 2013
29.178
+1.485
5.36%
jan 1, 2014
30.977
+1.799
6.16%
jan 1, 2015
32.738
+1.761
5.68%
jan 1, 2016
33.388
+0.651
1.99%
Ranking of countries by current statistics by years


Comments: