29
/
en
AIzaSyAYiBZKx7MnpbEhh9jyipgxe19OcubqV5w
April 1, 2024
62945
World
WLD
false
2
1
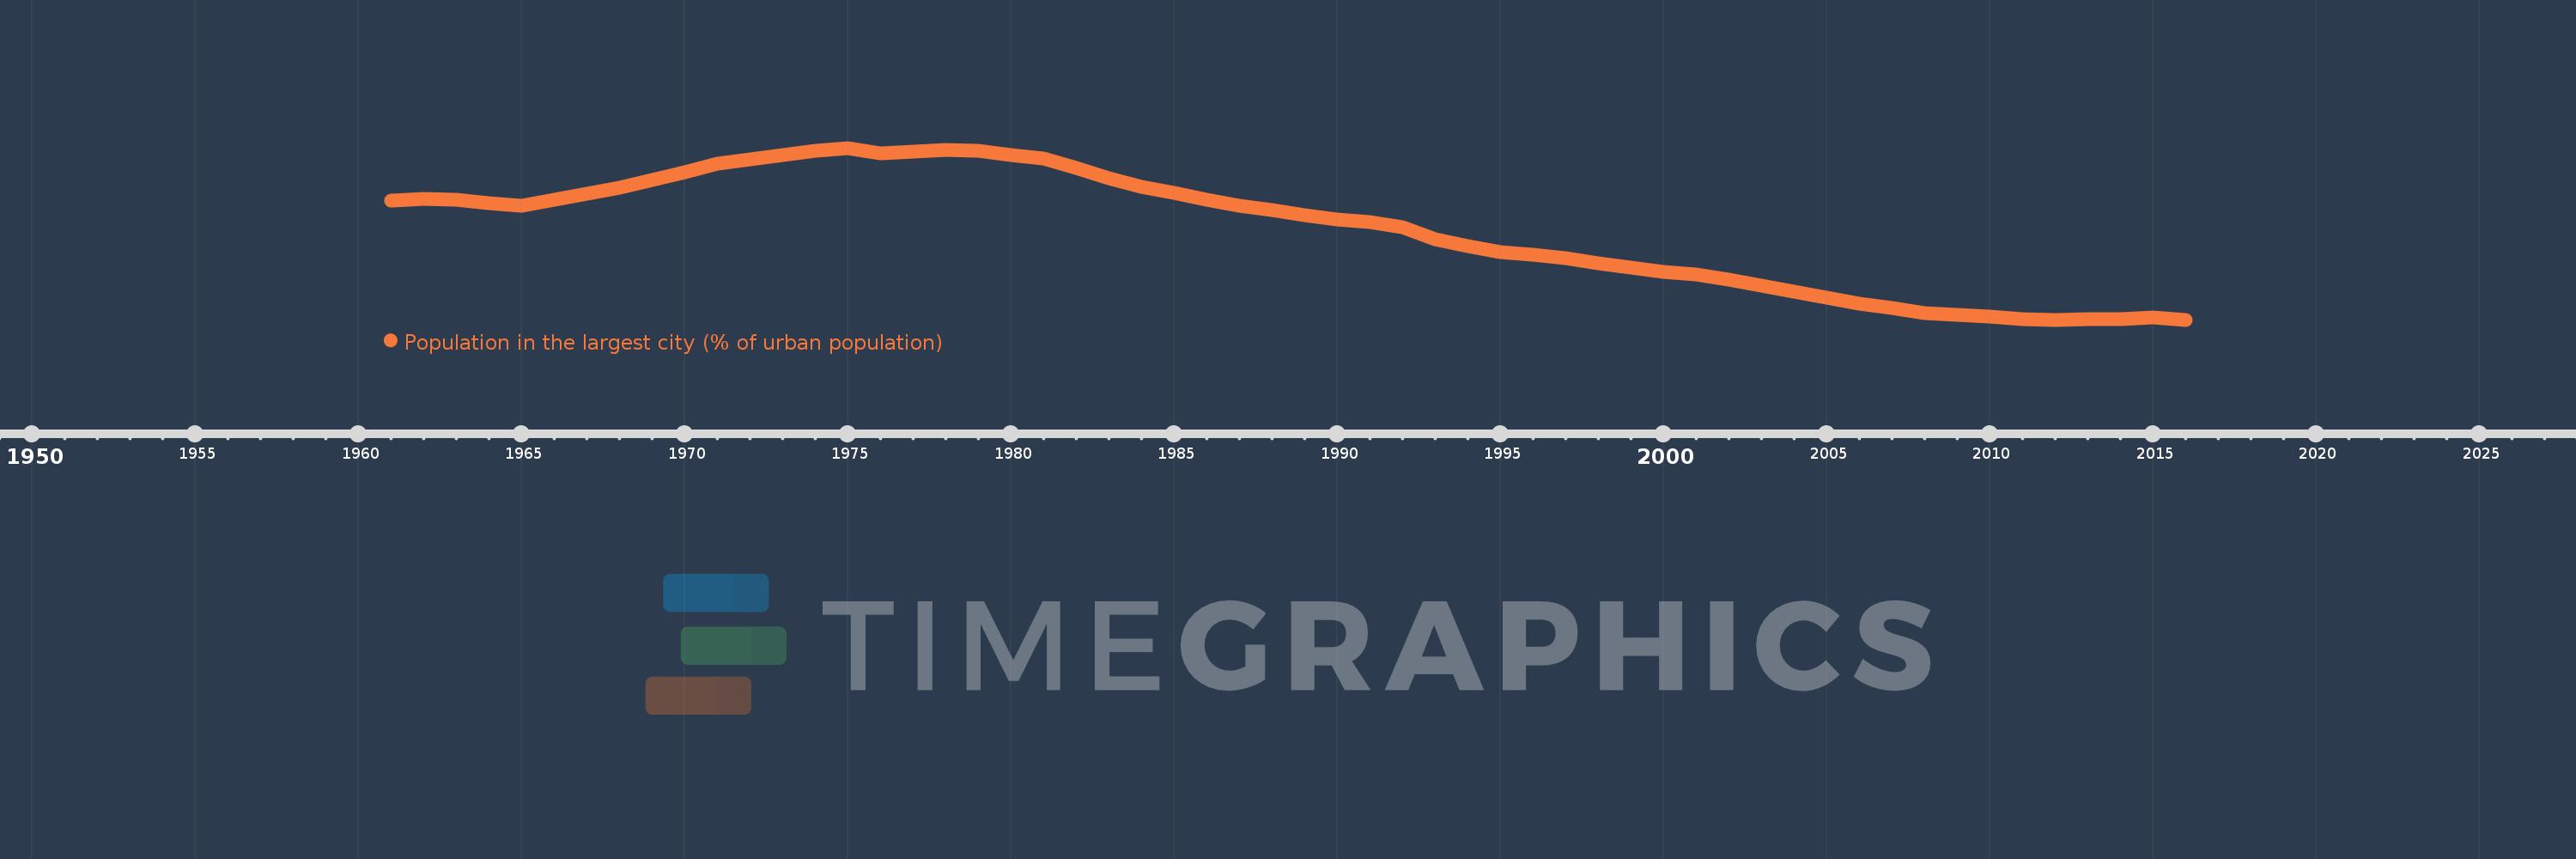
Population in the largest city (% of urban population)
2016,2015,2014,2013,2012,2011,2010,2009,2008,2007,2006,2005,2004,2003,2002,2001,2000,1999,1998,1997,1996,1995,1994,1993,1992,1991,1990,1989,1988,1987,1986,1985,1984,1983,1982,1981,1980,1979,1978,1977,1976,1975,1974,1973,1972,1971,1970,1969,1968,1967,1966,1965,1964,1963,1962,1961
This statistics in other country:
AfghanistanAlbaniaAlgeriaAngolaArab WorldArgentinaArmeniaAustraliaAustriaAzerbaijanBahrainBangladeshBelarusBelgiumBeninBoliviaBosnia and HerzegovinaBrazilBulgariaBurkina FasoBurundiCambodiaCameroonCanadaCentral African RepublicCentral Europe and the BalticsChadChileChinaColombiaCongo, Dem. Rep.Congo, Rep.Costa RicaCote d'IvoireCroatiaCubaCzech RepublicDenmarkDjiboutiDominican RepublicEarly-demographic dividendEast Asia & PacificEast Asia & Pacific (excluding high income)East Asia & Pacific (IDA & IBRD countries)EcuadorEgypt, Arab Rep.El SalvadorEritreaEstoniaEthiopiaEuro areaEurope & Central AsiaEurope & Central Asia (excluding high income)Europe & Central Asia (IDA & IBRD countries)European UnionFinlandFragile and conflict affected situationsFranceGabonGambia, TheGeorgiaGermanyGhanaGreeceGuatemalaGuineaGuinea-BissauHaitiHeavily indebted poor countries (HIPC)High incomeHondurasHong Kong SAR, ChinaHungaryIBRD onlyIDA & IBRD totalIDA blendIDA onlyIDA totalIndiaIndonesiaIran, Islamic Rep.IraqIrelandIsraelItalyJamaicaJapanJordanKazakhstanKenyaKorea, Dem. People’s Rep.Korea, Rep.KuwaitKyrgyz RepublicLao PDRLate-demographic dividendLatin America & Caribbean Latin America & Caribbean (excluding high income)Latin America & the Caribbean (IDA & IBRD countries)LatviaLeast developed countries: UN classificationLebanonLiberiaLibyaLithuaniaLow & middle incomeLow incomeLower middle incomeMacao SAR, ChinaMacedonia, FYRMadagascarMalawiMalaysiaMaliMauritaniaMexicoMiddle East & North AfricaMiddle East & North Africa (excluding high income)Middle East & North Africa (IDA & IBRD countries)Middle incomeMoldovaMongoliaMoroccoMozambiqueMyanmarNamibiaNepalNetherlandsNew ZealandNicaraguaNigerNigeriaNorth AmericaNorwayOECD membersOmanPakistanPanamaPapua New GuineaParaguayPeruPhilippinesPolandPortugalPost-demographic dividendPre-demographic dividendPuerto RicoQatarRomaniaRussian FederationRwandaSaudi ArabiaSenegalSerbiaSierra LeoneSingaporeSlovak RepublicSomaliaSouth AfricaSouth AsiaSouth Asia (IDA & IBRD)South SudanSpainSri LankaSub-Saharan Africa Sub-Saharan Africa (excluding high income)Sub-Saharan Africa (IDA & IBRD countries)SudanSwedenSwitzerlandSyrian Arab RepublicTajikistanTanzaniaThailandTogoTunisiaTurkeyTurkmenistanUgandaUkraineUnited Arab EmiratesUnited KingdomUnited StatesUpper middle incomeUruguayUzbekistanVenezuela, RBVietnamWest Bank and GazaWorldYemen, Rep.ZambiaZimbabwe Timeline:
This timeline shows a graph from 1961 to 2016 of World. No data until 1960. Number of actual observations by date: 56.
Source name:
World Development Indicators
Source organization:
United Nations, World Urbanization Prospects.
Categories, topics:
Urban Development
Last updated:
apr 23, 2017
Indicators value changes by year
Minimum:
16.303
jan 1, 2012
Maximum:
18.223
jan 1, 1975
At the date of observation
Value
Absolute change
Change from previous value
jan 1, 1961
17.634
+17.634
0.0%
jan 1, 1962
17.653
+0.018
0.1%
jan 1, 1963
17.646
-0.006
-0.04%
jan 1, 1964
17.608
-0.039
-0.22%
jan 1, 1965
17.578
-0.03
-0.17%
jan 1, 1966
17.648
+0.071
0.4%
jan 1, 1967
17.708
+0.059
0.34%
jan 1, 1968
17.776
+0.068
0.39%
jan 1, 1969
17.866
+0.09
0.51%
jan 1, 1970
17.95
+0.083
0.47%
jan 1, 1971
18.047
+0.097
0.54%
jan 1, 1972
18.1
+0.053
0.29%
jan 1, 1973
18.142
+0.042
0.23%
jan 1, 1974
18.19
+0.048
0.27%
jan 1, 1975
18.223
+0.033
0.18%
jan 1, 1976
18.16
-0.063
-0.35%
jan 1, 1977
18.184
+0.024
0.13%
jan 1, 1978
18.199
+0.015
0.08%
jan 1, 1979
18.187
-0.011
-0.06%
jan 1, 1980
18.146
-0.041
-0.22%
jan 1, 1981
18.101
-0.046
-0.25%
jan 1, 1982
17.999
-0.102
-0.56%
jan 1, 1983
17.884
-0.115
-0.64%
jan 1, 1984
17.792
-0.092
-0.51%
jan 1, 1985
17.717
-0.075
-0.42%
jan 1, 1986
17.645
-0.072
-0.41%
jan 1, 1987
17.578
-0.067
-0.38%
jan 1, 1988
17.531
-0.047
-0.27%
jan 1, 1989
17.473
-0.058
-0.33%
jan 1, 1990
17.428
-0.044
-0.25%
jan 1, 1991
17.39
-0.038
-0.22%
jan 1, 1992
17.334
-0.057
-0.33%
jan 1, 1993
17.205
-0.129
-0.74%
jan 1, 1994
17.127
-0.078
-0.45%
jan 1, 1995
17.06
-0.067
-0.39%
jan 1, 1996
17.032
-0.028
-0.16%
jan 1, 1997
16.992
-0.04
-0.23%
jan 1, 1998
16.938
-0.054
-0.32%
jan 1, 1999
16.888
-0.05
-0.3%
jan 1, 2000
16.841
-0.047
-0.28%
jan 1, 2001
16.806
-0.035
-0.21%
jan 1, 2002
16.749
-0.057
-0.34%
jan 1, 2003
16.682
-0.066
-0.4%
jan 1, 2004
16.613
-0.069
-0.41%
jan 1, 2005
16.547
-0.066
-0.4%
jan 1, 2006
16.482
-0.065
-0.39%
jan 1, 2007
16.432
-0.05
-0.31%
jan 1, 2008
16.378
-0.054
-0.33%
jan 1, 2009
16.362
-0.016
-0.1%
jan 1, 2010
16.34
-0.022
-0.13%
jan 1, 2011
16.31
-0.03
-0.18%
jan 1, 2012
16.303
-0.007
-0.04%
jan 1, 2013
16.309
+0.005
0.03%
jan 1, 2014
16.308
0.0
0.0%
jan 1, 2015
16.326
+0.018
0.11%
jan 1, 2016
16.304
-0.022
-0.14%
Ranking of countries by current statistics by years


Comments: