29
/
en
AIzaSyAYiBZKx7MnpbEhh9jyipgxe19OcubqV5w
April 1, 2024
287707
Zimbabwe
ZWE
true
2
1
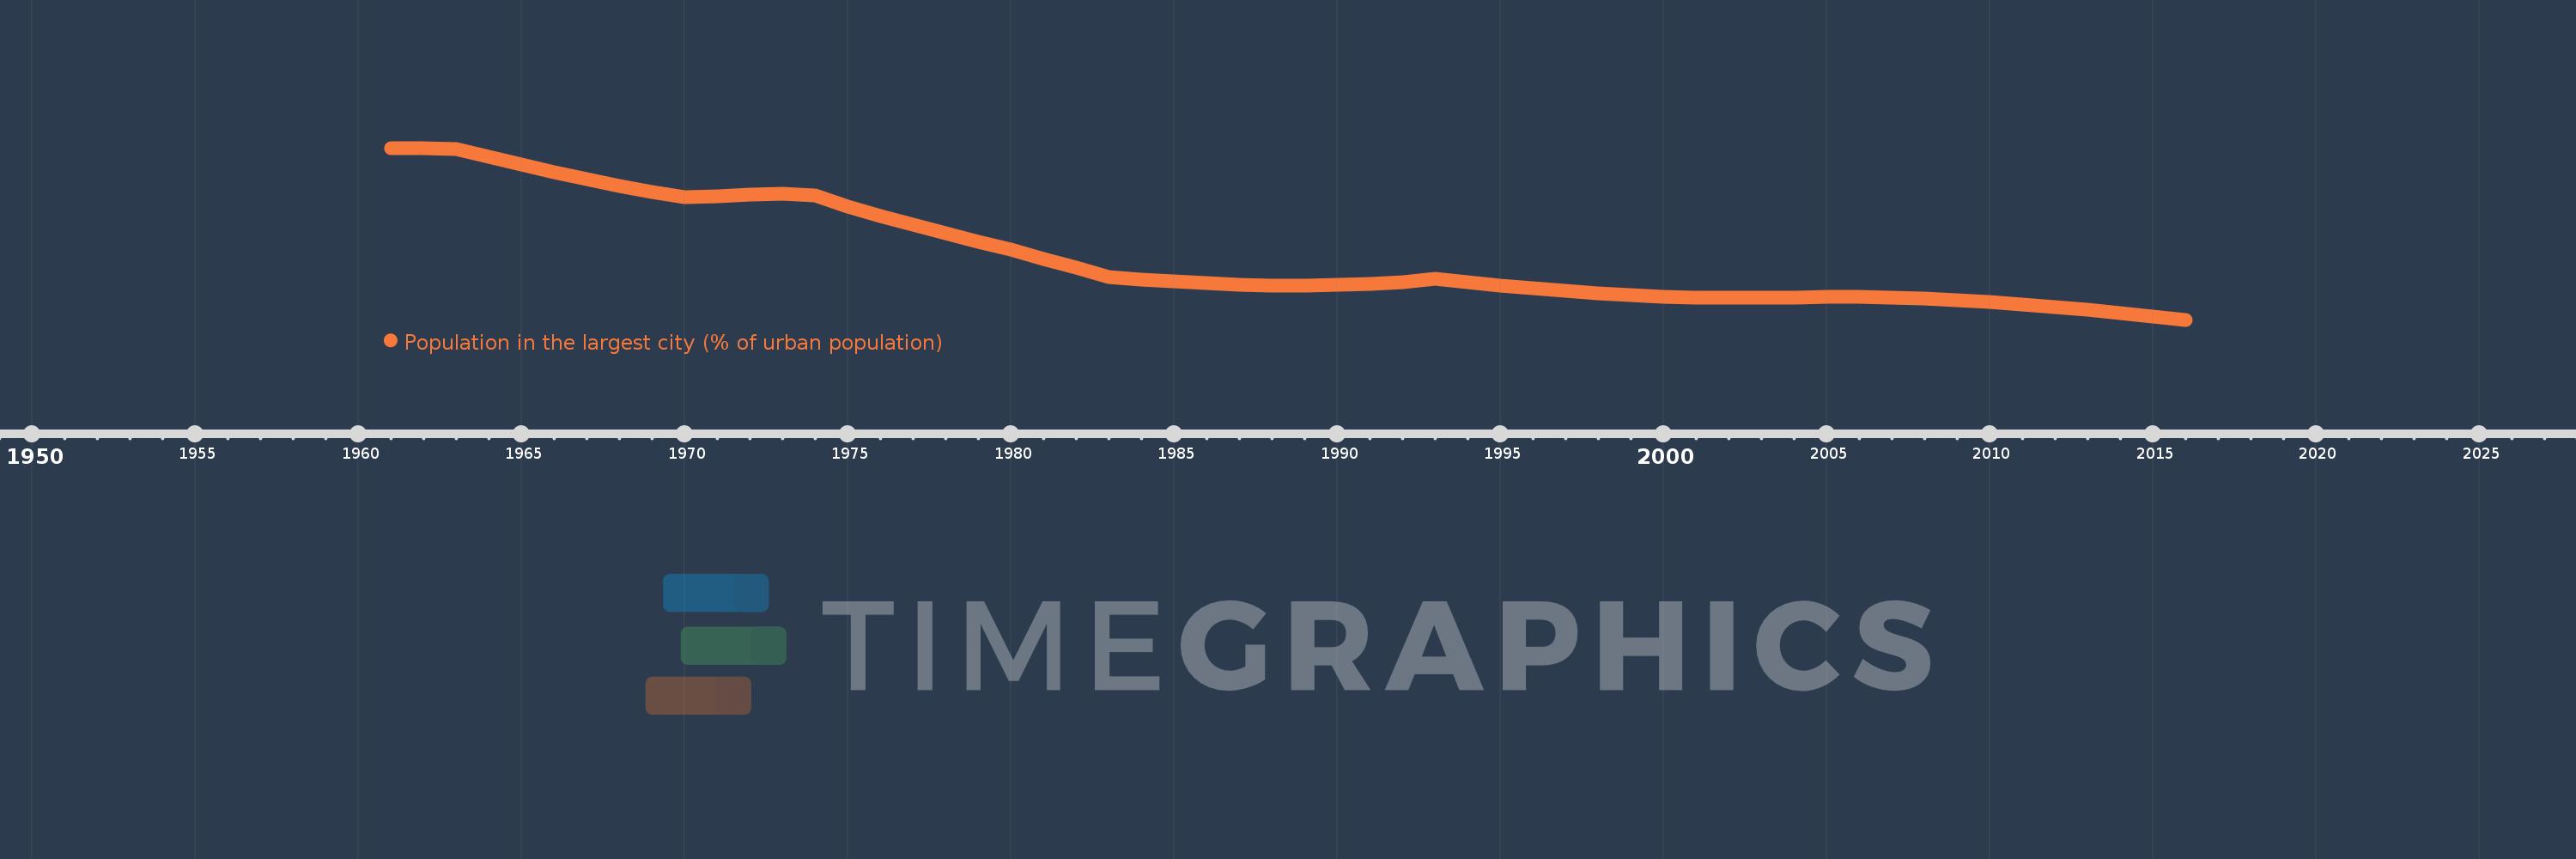
Population in the largest city (% of urban population)
2016,2015,2014,2013,2012,2011,2010,2009,2008,2007,2006,2005,2004,2003,2002,2001,2000,1999,1998,1997,1996,1995,1994,1993,1992,1991,1990,1989,1988,1987,1986,1985,1984,1983,1982,1981,1980,1979,1978,1977,1976,1975,1974,1973,1972,1971,1970,1969,1968,1967,1966,1965,1964,1963,1962,1961
This statistics in other country:
AfghanistanAlbaniaAlgeriaAngolaArab WorldArgentinaArmeniaAustraliaAustriaAzerbaijanBahrainBangladeshBelarusBelgiumBeninBoliviaBosnia and HerzegovinaBrazilBulgariaBurkina FasoBurundiCambodiaCameroonCanadaCentral African RepublicCentral Europe and the BalticsChadChileChinaColombiaCongo, Dem. Rep.Congo, Rep.Costa RicaCote d'IvoireCroatiaCubaCzech RepublicDenmarkDjiboutiDominican RepublicEarly-demographic dividendEast Asia & PacificEast Asia & Pacific (excluding high income)East Asia & Pacific (IDA & IBRD countries)EcuadorEgypt, Arab Rep.El SalvadorEritreaEstoniaEthiopiaEuro areaEurope & Central AsiaEurope & Central Asia (excluding high income)Europe & Central Asia (IDA & IBRD countries)European UnionFinlandFragile and conflict affected situationsFranceGabonGambia, TheGeorgiaGermanyGhanaGreeceGuatemalaGuineaGuinea-BissauHaitiHeavily indebted poor countries (HIPC)High incomeHondurasHong Kong SAR, ChinaHungaryIBRD onlyIDA & IBRD totalIDA blendIDA onlyIDA totalIndiaIndonesiaIran, Islamic Rep.IraqIrelandIsraelItalyJamaicaJapanJordanKazakhstanKenyaKorea, Dem. People’s Rep.Korea, Rep.KuwaitKyrgyz RepublicLao PDRLate-demographic dividendLatin America & Caribbean Latin America & Caribbean (excluding high income)Latin America & the Caribbean (IDA & IBRD countries)LatviaLeast developed countries: UN classificationLebanonLiberiaLibyaLithuaniaLow & middle incomeLow incomeLower middle incomeMacao SAR, ChinaMacedonia, FYRMadagascarMalawiMalaysiaMaliMauritaniaMexicoMiddle East & North AfricaMiddle East & North Africa (excluding high income)Middle East & North Africa (IDA & IBRD countries)Middle incomeMoldovaMongoliaMoroccoMozambiqueMyanmarNamibiaNepalNetherlandsNew ZealandNicaraguaNigerNigeriaNorth AmericaNorwayOECD membersOmanPakistanPanamaPapua New GuineaParaguayPeruPhilippinesPolandPortugalPost-demographic dividendPre-demographic dividendPuerto RicoQatarRomaniaRussian FederationRwandaSaudi ArabiaSenegalSerbiaSierra LeoneSingaporeSlovak RepublicSomaliaSouth AfricaSouth AsiaSouth Asia (IDA & IBRD)South SudanSpainSri LankaSub-Saharan Africa Sub-Saharan Africa (excluding high income)Sub-Saharan Africa (IDA & IBRD countries)SudanSwedenSwitzerlandSyrian Arab RepublicTajikistanTanzaniaThailandTogoTunisiaTurkeyTurkmenistanUgandaUkraineUnited Arab EmiratesUnited KingdomUnited StatesUpper middle incomeUruguayUzbekistanVenezuela, RBVietnamWest Bank and GazaWorldYemen, Rep.ZambiaZimbabwe Timeline:
This timeline shows a graph from 1961 to 2016 of Zimbabwe. No data until 1960. Number of actual observations by date: 56.
Source name:
World Development Indicators
Source organization:
United Nations, World Urbanization Prospects.
Categories, topics:
Urban Development
Last updated:
apr 23, 2017
Indicators value changes by year
Minimum:
29.721
jan 1, 2016
Maximum:
52.453
jan 1, 1962
At the date of observation
Value
Absolute change
Change from previous value
jan 1, 1961
52.415
+52.415
0.0%
jan 1, 1962
52.453
+0.038
0.07%
jan 1, 1963
52.3
-0.153
-0.29%
jan 1, 1964
51.258
-1.042
-1.99%
jan 1, 1965
50.246
-1.011
-1.97%
jan 1, 1966
49.276
-0.971
-1.93%
jan 1, 1967
48.348
-0.928
-1.88%
jan 1, 1968
47.455
-0.893
-1.85%
jan 1, 1969
46.59
-0.865
-1.82%
jan 1, 1970
45.907
-0.683
-1.47%
jan 1, 1971
46.082
+0.175
0.38%
jan 1, 1972
46.237
+0.154
0.34%
jan 1, 1973
46.378
+0.141
0.3%
jan 1, 1974
46.113
-0.265
-0.57%
jan 1, 1975
44.652
-1.461
-3.17%
jan 1, 1976
43.412
-1.24
-2.78%
jan 1, 1977
42.249
-1.163
-2.68%
jan 1, 1978
41.146
-1.103
-2.61%
jan 1, 1979
40.063
-1.084
-2.63%
jan 1, 1980
38.952
-1.11
-2.77%
jan 1, 1981
37.797
-1.156
-2.97%
jan 1, 1982
36.607
-1.189
-3.15%
jan 1, 1983
35.412
-1.195
-3.26%
jan 1, 1984
35.011
-0.402
-1.13%
jan 1, 1985
34.755
-0.256
-0.73%
jan 1, 1986
34.543
-0.211
-0.61%
jan 1, 1987
34.385
-0.158
-0.46%
jan 1, 1988
34.279
-0.106
-0.31%
jan 1, 1989
34.248
-0.031
-0.09%
jan 1, 1990
34.303
+0.055
0.16%
jan 1, 1991
34.464
+0.161
0.47%
jan 1, 1992
34.731
+0.268
0.78%
jan 1, 1993
35.106
+0.374
1.08%
jan 1, 1994
34.705
-0.4
-1.14%
jan 1, 1995
34.25
-0.456
-1.31%
jan 1, 1996
33.856
-0.393
-1.15%
jan 1, 1997
33.514
-0.342
-1.01%
jan 1, 1998
33.22
-0.295
-0.88%
jan 1, 1999
32.979
-0.24
-0.72%
jan 1, 2000
32.801
-0.179
-0.54%
jan 1, 2001
32.686
-0.115
-0.35%
jan 1, 2002
32.634
-0.052
-0.16%
jan 1, 2003
32.63
-0.004
-0.01%
jan 1, 2004
32.695
+0.065
0.2%
jan 1, 2005
32.743
+0.048
0.15%
jan 1, 2006
32.734
-0.008
-0.03%
jan 1, 2007
32.663
-0.072
-0.22%
jan 1, 2008
32.53
-0.132
-0.41%
jan 1, 2009
32.338
-0.192
-0.59%
jan 1, 2010
32.088
-0.25
-0.77%
jan 1, 2011
31.788
-0.301
-0.94%
jan 1, 2012
31.437
-0.351
-1.1%
jan 1, 2013
31.042
-0.394
-1.25%
jan 1, 2014
30.62
-0.422
-1.36%
jan 1, 2015
30.164
-0.456
-1.49%
jan 1, 2016
29.721
-0.443
-1.47%
Ranking of countries by current statistics by years


Comments: