29
/
en
AIzaSyAYiBZKx7MnpbEhh9jyipgxe19OcubqV5w
April 1, 2024
155118
India
IND
true
2
1
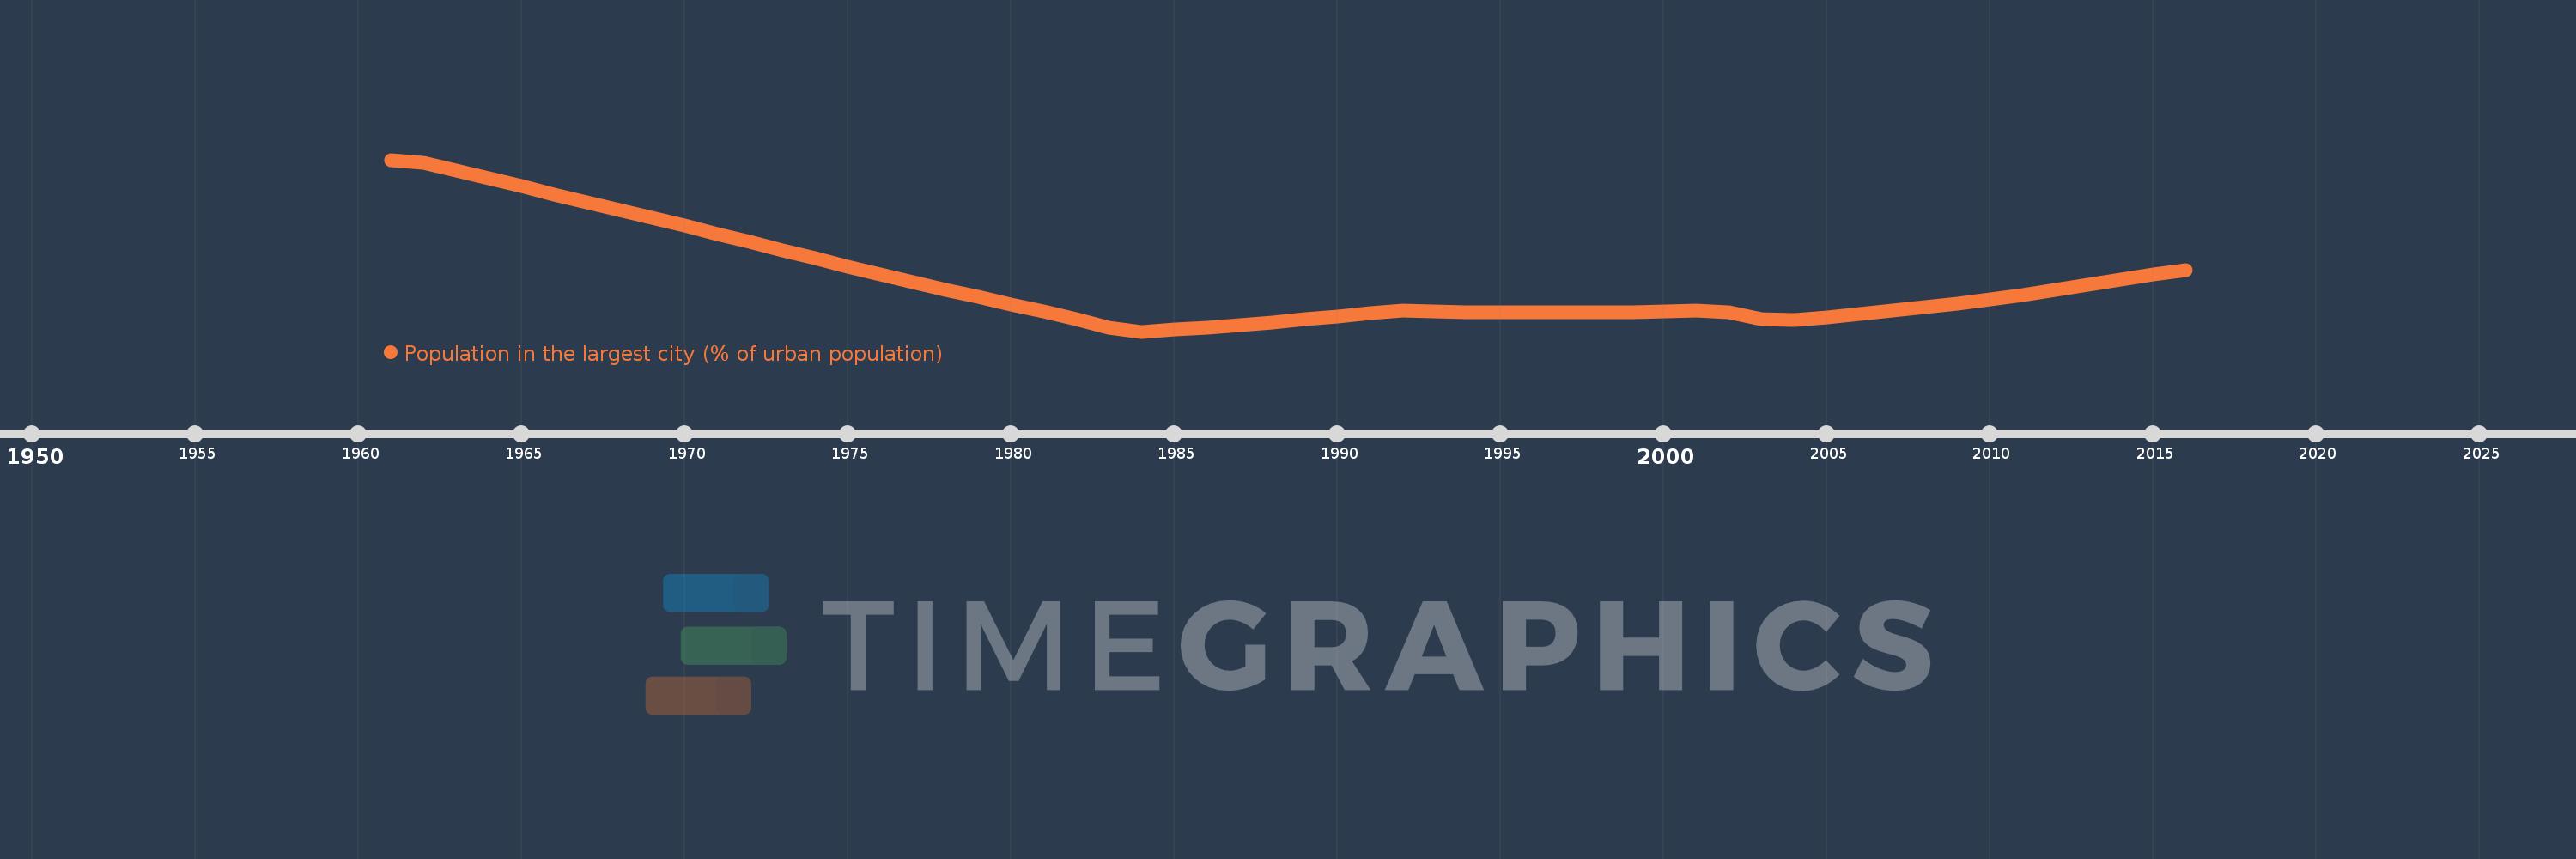
Population in the largest city (% of urban population)
2016,2015,2014,2013,2012,2011,2010,2009,2008,2007,2006,2005,2004,2003,2002,2001,2000,1999,1998,1997,1996,1995,1994,1993,1992,1991,1990,1989,1988,1987,1986,1985,1984,1983,1982,1981,1980,1979,1978,1977,1976,1975,1974,1973,1972,1971,1970,1969,1968,1967,1966,1965,1964,1963,1962,1961
This statistics in other country:
AfghanistanAlbaniaAlgeriaAngolaArab WorldArgentinaArmeniaAustraliaAustriaAzerbaijanBahrainBangladeshBelarusBelgiumBeninBoliviaBosnia and HerzegovinaBrazilBulgariaBurkina FasoBurundiCambodiaCameroonCanadaCentral African RepublicCentral Europe and the BalticsChadChileChinaColombiaCongo, Dem. Rep.Congo, Rep.Costa RicaCote d'IvoireCroatiaCubaCzech RepublicDenmarkDjiboutiDominican RepublicEarly-demographic dividendEast Asia & PacificEast Asia & Pacific (excluding high income)East Asia & Pacific (IDA & IBRD countries)EcuadorEgypt, Arab Rep.El SalvadorEritreaEstoniaEthiopiaEuro areaEurope & Central AsiaEurope & Central Asia (excluding high income)Europe & Central Asia (IDA & IBRD countries)European UnionFinlandFragile and conflict affected situationsFranceGabonGambia, TheGeorgiaGermanyGhanaGreeceGuatemalaGuineaGuinea-BissauHaitiHeavily indebted poor countries (HIPC)High incomeHondurasHong Kong SAR, ChinaHungaryIBRD onlyIDA & IBRD totalIDA blendIDA onlyIDA totalIndiaIndonesiaIran, Islamic Rep.IraqIrelandIsraelItalyJamaicaJapanJordanKazakhstanKenyaKorea, Dem. People’s Rep.Korea, Rep.KuwaitKyrgyz RepublicLao PDRLate-demographic dividendLatin America & Caribbean Latin America & Caribbean (excluding high income)Latin America & the Caribbean (IDA & IBRD countries)LatviaLeast developed countries: UN classificationLebanonLiberiaLibyaLithuaniaLow & middle incomeLow incomeLower middle incomeMacao SAR, ChinaMacedonia, FYRMadagascarMalawiMalaysiaMaliMauritaniaMexicoMiddle East & North AfricaMiddle East & North Africa (excluding high income)Middle East & North Africa (IDA & IBRD countries)Middle incomeMoldovaMongoliaMoroccoMozambiqueMyanmarNamibiaNepalNetherlandsNew ZealandNicaraguaNigerNigeriaNorth AmericaNorwayOECD membersOmanPakistanPanamaPapua New GuineaParaguayPeruPhilippinesPolandPortugalPost-demographic dividendPre-demographic dividendPuerto RicoQatarRomaniaRussian FederationRwandaSaudi ArabiaSenegalSerbiaSierra LeoneSingaporeSlovak RepublicSomaliaSouth AfricaSouth AsiaSouth Asia (IDA & IBRD)South SudanSpainSri LankaSub-Saharan Africa Sub-Saharan Africa (excluding high income)Sub-Saharan Africa (IDA & IBRD countries)SudanSwedenSwitzerlandSyrian Arab RepublicTajikistanTanzaniaThailandTogoTunisiaTurkeyTurkmenistanUgandaUkraineUnited Arab EmiratesUnited KingdomUnited StatesUpper middle incomeUruguayUzbekistanVenezuela, RBVietnamWest Bank and GazaWorldYemen, Rep.ZambiaZimbabwe Timeline:
This timeline shows a graph from 1961 to 2016 of India. No data until 1960. Number of actual observations by date: 56.
Source name:
World Development Indicators
Source organization:
United Nations, World Urbanization Prospects.
Categories, topics:
Urban Development
Last updated:
apr 23, 2017
Indicators value changes by year
At the date of observation
Value
Absolute change
Change from previous value
jan 1, 1961
7.013
+7.013
0.0%
jan 1, 1962
6.983
-0.03
-0.43%
jan 1, 1963
6.911
-0.071
-1.02%
jan 1, 1964
6.839
-0.072
-1.04%
jan 1, 1965
6.766
-0.073
-1.06%
jan 1, 1966
6.694
-0.073
-1.07%
jan 1, 1967
6.622
-0.072
-1.08%
jan 1, 1968
6.55
-0.072
-1.09%
jan 1, 1969
6.477
-0.072
-1.1%
jan 1, 1970
6.403
-0.074
-1.14%
jan 1, 1971
6.327
-0.076
-1.19%
jan 1, 1972
6.25
-0.078
-1.23%
jan 1, 1973
6.173
-0.076
-1.22%
jan 1, 1974
6.097
-0.076
-1.24%
jan 1, 1975
6.021
-0.076
-1.24%
jan 1, 1976
5.948
-0.073
-1.22%
jan 1, 1977
5.877
-0.071
-1.19%
jan 1, 1978
5.808
-0.069
-1.18%
jan 1, 1979
5.74
-0.067
-1.16%
jan 1, 1980
5.673
-0.067
-1.16%
jan 1, 1981
5.607
-0.066
-1.17%
jan 1, 1982
5.536
-0.072
-1.28%
jan 1, 1983
5.454
-0.082
-1.47%
jan 1, 1984
5.419
-0.036
-0.65%
jan 1, 1985
5.437
+0.018
0.34%
jan 1, 1986
5.457
+0.02
0.37%
jan 1, 1987
5.479
+0.022
0.41%
jan 1, 1988
5.504
+0.025
0.45%
jan 1, 1989
5.531
+0.027
0.49%
jan 1, 1990
5.56
+0.029
0.52%
jan 1, 1991
5.592
+0.032
0.57%
jan 1, 1992
5.611
+0.02
0.35%
jan 1, 1993
5.605
-0.006
-0.11%
jan 1, 1994
5.601
-0.004
-0.08%
jan 1, 1995
5.598
-0.003
-0.05%
jan 1, 1996
5.597
-0.001
-0.02%
jan 1, 1997
5.597
+0.0
0.0%
jan 1, 1998
5.599
+0.001
0.02%
jan 1, 1999
5.602
+0.003
0.06%
jan 1, 2000
5.607
+0.005
0.1%
jan 1, 2001
5.615
+0.008
0.14%
jan 1, 2002
5.598
-0.017
-0.3%
jan 1, 2003
5.531
-0.067
-1.2%
jan 1, 2004
5.528
-0.003
-0.06%
jan 1, 2005
5.553
+0.025
0.46%
jan 1, 2006
5.581
+0.028
0.5%
jan 1, 2007
5.611
+0.031
0.55%
jan 1, 2008
5.644
+0.033
0.59%
jan 1, 2009
5.68
+0.036
0.64%
jan 1, 2010
5.719
+0.039
0.68%
jan 1, 2011
5.761
+0.042
0.74%
jan 1, 2012
5.806
+0.045
0.79%
jan 1, 2013
5.853
+0.047
0.81%
jan 1, 2014
5.902
+0.049
0.83%
jan 1, 2015
5.952
+0.05
0.84%
jan 1, 2016
5.987
+0.035
0.58%
Ranking of countries by current statistics by years


Comments: