29
/
en
AIzaSyAYiBZKx7MnpbEhh9jyipgxe19OcubqV5w
April 1, 2024
119293
Denmark
DNK
true
2
1
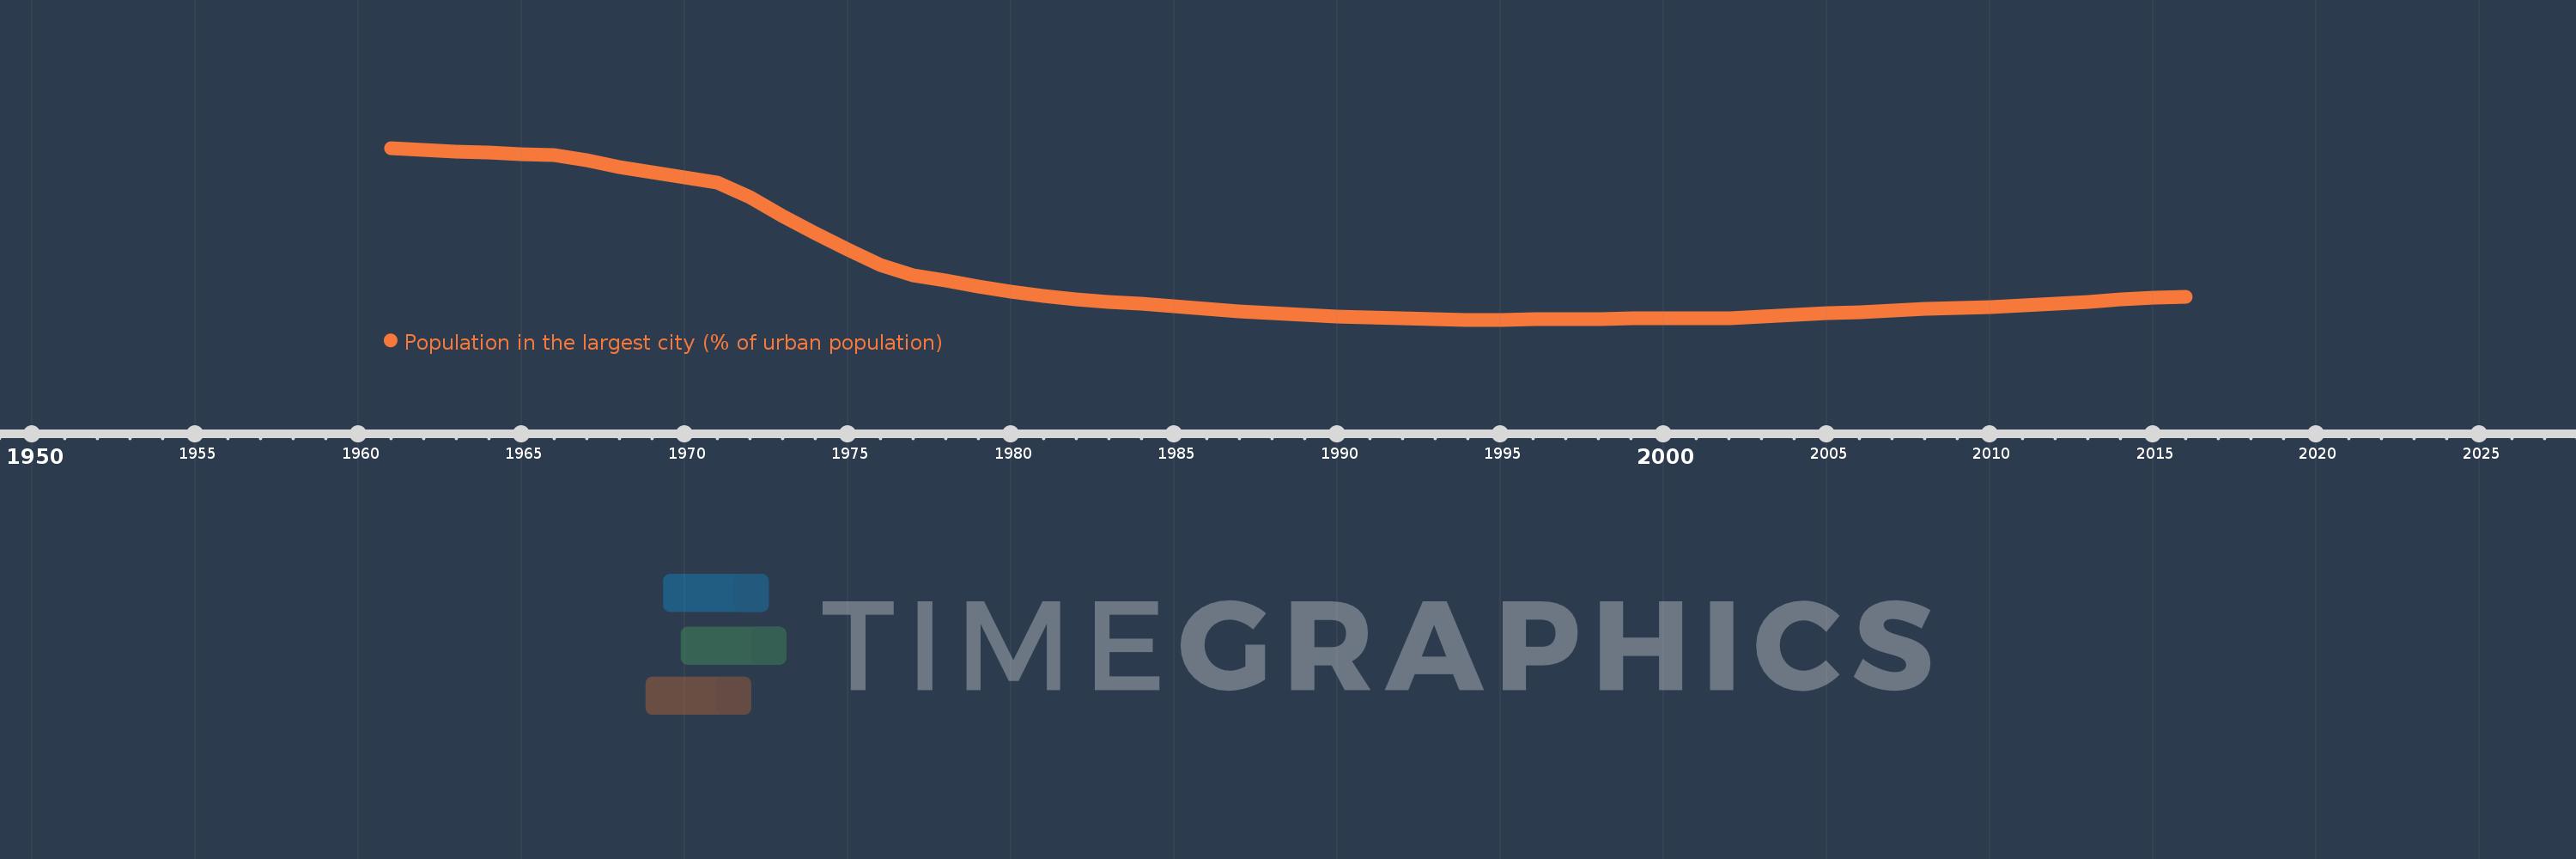
Population in the largest city (% of urban population)
2016,2015,2014,2013,2012,2011,2010,2009,2008,2007,2006,2005,2004,2003,2002,2001,2000,1999,1998,1997,1996,1995,1994,1993,1992,1991,1990,1989,1988,1987,1986,1985,1984,1983,1982,1981,1980,1979,1978,1977,1976,1975,1974,1973,1972,1971,1970,1969,1968,1967,1966,1965,1964,1963,1962,1961
This statistics in other country:
AfghanistanAlbaniaAlgeriaAngolaArab WorldArgentinaArmeniaAustraliaAustriaAzerbaijanBahrainBangladeshBelarusBelgiumBeninBoliviaBosnia and HerzegovinaBrazilBulgariaBurkina FasoBurundiCambodiaCameroonCanadaCentral African RepublicCentral Europe and the BalticsChadChileChinaColombiaCongo, Dem. Rep.Congo, Rep.Costa RicaCote d'IvoireCroatiaCubaCzech RepublicDenmarkDjiboutiDominican RepublicEarly-demographic dividendEast Asia & PacificEast Asia & Pacific (excluding high income)East Asia & Pacific (IDA & IBRD countries)EcuadorEgypt, Arab Rep.El SalvadorEritreaEstoniaEthiopiaEuro areaEurope & Central AsiaEurope & Central Asia (excluding high income)Europe & Central Asia (IDA & IBRD countries)European UnionFinlandFragile and conflict affected situationsFranceGabonGambia, TheGeorgiaGermanyGhanaGreeceGuatemalaGuineaGuinea-BissauHaitiHeavily indebted poor countries (HIPC)High incomeHondurasHong Kong SAR, ChinaHungaryIBRD onlyIDA & IBRD totalIDA blendIDA onlyIDA totalIndiaIndonesiaIran, Islamic Rep.IraqIrelandIsraelItalyJamaicaJapanJordanKazakhstanKenyaKorea, Dem. People’s Rep.Korea, Rep.KuwaitKyrgyz RepublicLao PDRLate-demographic dividendLatin America & Caribbean Latin America & Caribbean (excluding high income)Latin America & the Caribbean (IDA & IBRD countries)LatviaLeast developed countries: UN classificationLebanonLiberiaLibyaLithuaniaLow & middle incomeLow incomeLower middle incomeMacao SAR, ChinaMacedonia, FYRMadagascarMalawiMalaysiaMaliMauritaniaMexicoMiddle East & North AfricaMiddle East & North Africa (excluding high income)Middle East & North Africa (IDA & IBRD countries)Middle incomeMoldovaMongoliaMoroccoMozambiqueMyanmarNamibiaNepalNetherlandsNew ZealandNicaraguaNigerNigeriaNorth AmericaNorwayOECD membersOmanPakistanPanamaPapua New GuineaParaguayPeruPhilippinesPolandPortugalPost-demographic dividendPre-demographic dividendPuerto RicoQatarRomaniaRussian FederationRwandaSaudi ArabiaSenegalSerbiaSierra LeoneSingaporeSlovak RepublicSomaliaSouth AfricaSouth AsiaSouth Asia (IDA & IBRD)South SudanSpainSri LankaSub-Saharan Africa Sub-Saharan Africa (excluding high income)Sub-Saharan Africa (IDA & IBRD countries)SudanSwedenSwitzerlandSyrian Arab RepublicTajikistanTanzaniaThailandTogoTunisiaTurkeyTurkmenistanUgandaUkraineUnited Arab EmiratesUnited KingdomUnited StatesUpper middle incomeUruguayUzbekistanVenezuela, RBVietnamWest Bank and GazaWorldYemen, Rep.ZambiaZimbabwe Timeline:
This timeline shows a graph from 1961 to 2016 of Denmark. No data until 1960. Number of actual observations by date: 56.
Source name:
World Development Indicators
Source organization:
United Nations, World Urbanization Prospects.
Categories, topics:
Urban Development
Last updated:
apr 23, 2017
Indicators value changes by year
Minimum:
23.557
jan 1, 1994
Maximum:
38.061
jan 1, 1961
At the date of observation
Value
Absolute change
Change from previous value
jan 1, 1961
38.061
+38.061
0.0%
jan 1, 1962
37.878
-0.183
-0.48%
jan 1, 1963
37.759
-0.119
-0.31%
jan 1, 1964
37.646
-0.113
-0.3%
jan 1, 1965
37.539
-0.107
-0.29%
jan 1, 1966
37.447
-0.092
-0.25%
jan 1, 1967
37.006
-0.441
-1.18%
jan 1, 1968
36.473
-0.533
-1.44%
jan 1, 1969
36.019
-0.455
-1.25%
jan 1, 1970
35.596
-0.422
-1.17%
jan 1, 1971
35.115
-0.482
-1.35%
jan 1, 1972
33.883
-1.232
-3.51%
jan 1, 1973
32.321
-1.561
-4.61%
jan 1, 1974
30.831
-1.491
-4.61%
jan 1, 1975
29.452
-1.379
-4.47%
jan 1, 1976
28.189
-1.263
-4.29%
jan 1, 1977
27.323
-0.866
-3.07%
jan 1, 1978
26.851
-0.472
-1.73%
jan 1, 1979
26.388
-0.463
-1.72%
jan 1, 1980
25.952
-0.436
-1.65%
jan 1, 1981
25.556
-0.396
-1.53%
jan 1, 1982
25.278
-0.278
-1.09%
jan 1, 1983
25.088
-0.19
-0.75%
jan 1, 1984
24.898
-0.19
-0.76%
jan 1, 1985
24.706
-0.192
-0.77%
jan 1, 1986
24.493
-0.213
-0.86%
jan 1, 1987
24.285
-0.208
-0.85%
jan 1, 1988
24.107
-0.178
-0.73%
jan 1, 1989
23.948
-0.158
-0.66%
jan 1, 1990
23.821
-0.128
-0.53%
jan 1, 1991
23.736
-0.085
-0.36%
jan 1, 1992
23.662
-0.074
-0.31%
jan 1, 1993
23.597
-0.065
-0.27%
jan 1, 1994
23.557
-0.04
-0.17%
jan 1, 1995
23.563
+0.006
0.02%
jan 1, 1996
23.573
+0.01
0.04%
jan 1, 1997
23.595
+0.022
0.09%
jan 1, 1998
23.639
+0.044
0.19%
jan 1, 1999
23.656
+0.017
0.07%
jan 1, 2000
23.679
+0.023
0.1%
jan 1, 2001
23.704
+0.025
0.11%
jan 1, 2002
23.714
+0.009
0.04%
jan 1, 2003
23.794
+0.08
0.34%
jan 1, 2004
23.961
+0.167
0.7%
jan 1, 2005
24.105
+0.144
0.6%
jan 1, 2006
24.222
+0.117
0.48%
jan 1, 2007
24.341
+0.119
0.49%
jan 1, 2008
24.45
+0.11
0.45%
jan 1, 2009
24.531
+0.081
0.33%
jan 1, 2010
24.631
+0.101
0.41%
jan 1, 2011
24.763
+0.131
0.53%
jan 1, 2012
24.917
+0.154
0.62%
jan 1, 2013
25.094
+0.177
0.71%
jan 1, 2014
25.262
+0.168
0.67%
jan 1, 2015
25.41
+0.148
0.59%
jan 1, 2016
25.481
+0.07
0.28%
Ranking of countries by current statistics by years


Comments: