29
/
en
AIzaSyAYiBZKx7MnpbEhh9jyipgxe19OcubqV5w
April 1, 2024
224090
Philippines
PHL
true
2
1
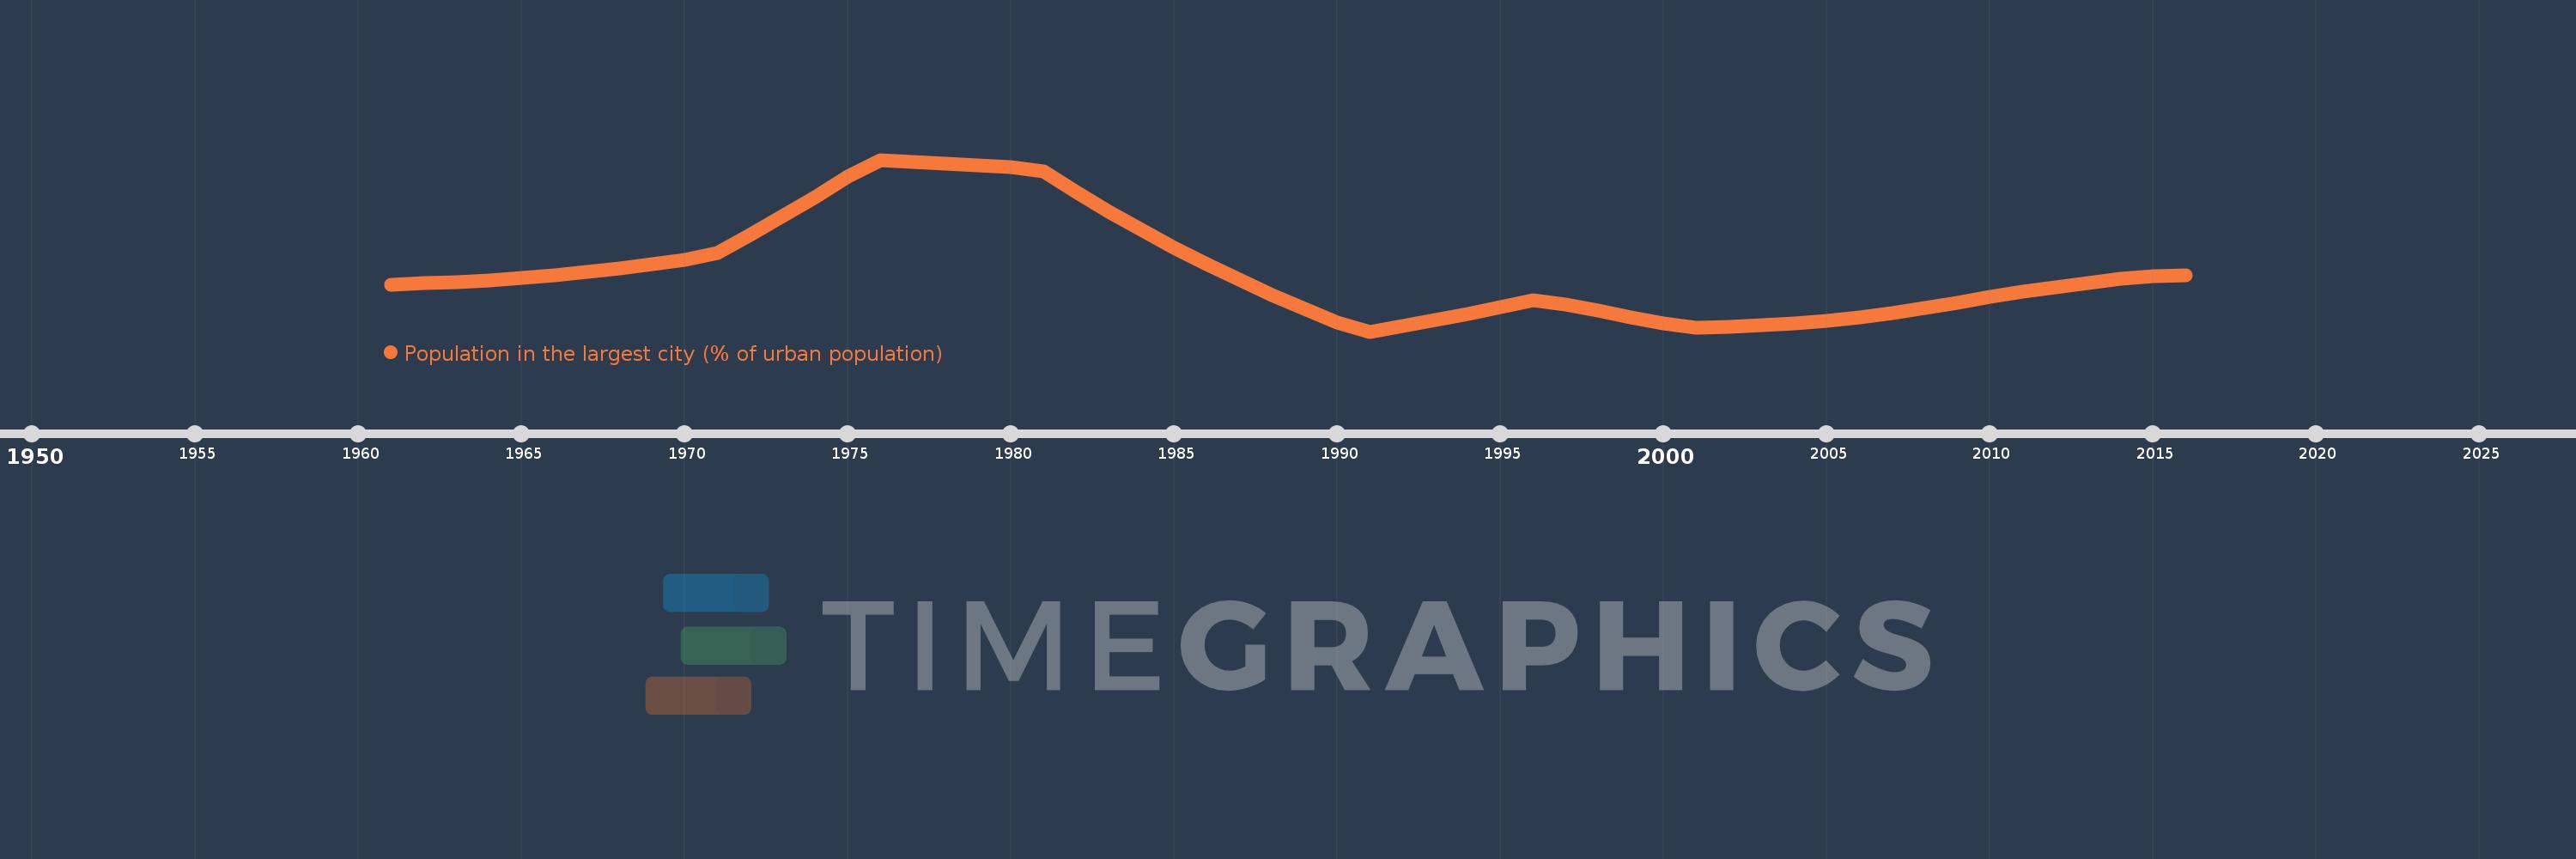
Population in the largest city (% of urban population)
2016,2015,2014,2013,2012,2011,2010,2009,2008,2007,2006,2005,2004,2003,2002,2001,2000,1999,1998,1997,1996,1995,1994,1993,1992,1991,1990,1989,1988,1987,1986,1985,1984,1983,1982,1981,1980,1979,1978,1977,1976,1975,1974,1973,1972,1971,1970,1969,1968,1967,1966,1965,1964,1963,1962,1961
This statistics in other country:
AfghanistanAlbaniaAlgeriaAngolaArab WorldArgentinaArmeniaAustraliaAustriaAzerbaijanBahrainBangladeshBelarusBelgiumBeninBoliviaBosnia and HerzegovinaBrazilBulgariaBurkina FasoBurundiCambodiaCameroonCanadaCentral African RepublicCentral Europe and the BalticsChadChileChinaColombiaCongo, Dem. Rep.Congo, Rep.Costa RicaCote d'IvoireCroatiaCubaCzech RepublicDenmarkDjiboutiDominican RepublicEarly-demographic dividendEast Asia & PacificEast Asia & Pacific (excluding high income)East Asia & Pacific (IDA & IBRD countries)EcuadorEgypt, Arab Rep.El SalvadorEritreaEstoniaEthiopiaEuro areaEurope & Central AsiaEurope & Central Asia (excluding high income)Europe & Central Asia (IDA & IBRD countries)European UnionFinlandFragile and conflict affected situationsFranceGabonGambia, TheGeorgiaGermanyGhanaGreeceGuatemalaGuineaGuinea-BissauHaitiHeavily indebted poor countries (HIPC)High incomeHondurasHong Kong SAR, ChinaHungaryIBRD onlyIDA & IBRD totalIDA blendIDA onlyIDA totalIndiaIndonesiaIran, Islamic Rep.IraqIrelandIsraelItalyJamaicaJapanJordanKazakhstanKenyaKorea, Dem. People’s Rep.Korea, Rep.KuwaitKyrgyz RepublicLao PDRLate-demographic dividendLatin America & Caribbean Latin America & Caribbean (excluding high income)Latin America & the Caribbean (IDA & IBRD countries)LatviaLeast developed countries: UN classificationLebanonLiberiaLibyaLithuaniaLow & middle incomeLow incomeLower middle incomeMacao SAR, ChinaMacedonia, FYRMadagascarMalawiMalaysiaMaliMauritaniaMexicoMiddle East & North AfricaMiddle East & North Africa (excluding high income)Middle East & North Africa (IDA & IBRD countries)Middle incomeMoldovaMongoliaMoroccoMozambiqueMyanmarNamibiaNepalNetherlandsNew ZealandNicaraguaNigerNigeriaNorth AmericaNorwayOECD membersOmanPakistanPanamaPapua New GuineaParaguayPeruPhilippinesPolandPortugalPost-demographic dividendPre-demographic dividendPuerto RicoQatarRomaniaRussian FederationRwandaSaudi ArabiaSenegalSerbiaSierra LeoneSingaporeSlovak RepublicSomaliaSouth AfricaSouth AsiaSouth Asia (IDA & IBRD)South SudanSpainSri LankaSub-Saharan Africa Sub-Saharan Africa (excluding high income)Sub-Saharan Africa (IDA & IBRD countries)SudanSwedenSwitzerlandSyrian Arab RepublicTajikistanTanzaniaThailandTogoTunisiaTurkeyTurkmenistanUgandaUkraineUnited Arab EmiratesUnited KingdomUnited StatesUpper middle incomeUruguayUzbekistanVenezuela, RBVietnamWest Bank and GazaWorldYemen, Rep.ZambiaZimbabwe Timeline:
This timeline shows a graph from 1961 to 2016 of Philippines. No data until 1960. Number of actual observations by date: 56.
Source name:
World Development Indicators
Source organization:
United Nations, World Urbanization Prospects.
Categories, topics:
Urban Development
Last updated:
apr 23, 2017
Indicators value changes by year
Minimum:
26.488
jan 1, 1991
Maximum:
34.045
jan 1, 1976
At the date of observation
Value
Absolute change
Change from previous value
jan 1, 1961
28.565
+28.565
0.0%
jan 1, 1962
28.616
+0.051
0.18%
jan 1, 1963
28.674
+0.058
0.2%
jan 1, 1964
28.745
+0.072
0.25%
jan 1, 1965
28.839
+0.094
0.33%
jan 1, 1966
28.955
+0.116
0.4%
jan 1, 1967
29.099
+0.144
0.5%
jan 1, 1968
29.267
+0.168
0.58%
jan 1, 1969
29.452
+0.186
0.63%
jan 1, 1970
29.644
+0.192
0.65%
jan 1, 1971
29.931
+0.287
0.97%
jan 1, 1972
30.728
+0.797
2.66%
jan 1, 1973
31.554
+0.826
2.69%
jan 1, 1974
32.405
+0.852
2.7%
jan 1, 1975
33.293
+0.888
2.74%
jan 1, 1976
34.045
+0.751
2.26%
jan 1, 1977
33.956
-0.089
-0.26%
jan 1, 1978
33.874
-0.082
-0.24%
jan 1, 1979
33.8
-0.074
-0.22%
jan 1, 1980
33.729
-0.071
-0.21%
jan 1, 1981
33.52
-0.209
-0.62%
jan 1, 1982
32.626
-0.894
-2.67%
jan 1, 1983
31.773
-0.853
-2.61%
jan 1, 1984
30.961
-0.812
-2.56%
jan 1, 1985
30.189
-0.773
-2.5%
jan 1, 1986
29.455
-0.733
-2.43%
jan 1, 1987
28.761
-0.695
-2.36%
jan 1, 1988
28.102
-0.658
-2.29%
jan 1, 1989
27.482
-0.62
-2.21%
jan 1, 1990
26.901
-0.581
-2.11%
jan 1, 1991
26.488
-0.414
-1.54%
jan 1, 1992
26.735
+0.247
0.93%
jan 1, 1993
26.999
+0.264
0.99%
jan 1, 1994
27.276
+0.278
1.03%
jan 1, 1995
27.57
+0.293
1.08%
jan 1, 1996
27.877
+0.307
1.12%
jan 1, 1997
27.682
-0.195
-0.7%
jan 1, 1998
27.395
-0.287
-1.04%
jan 1, 1999
27.122
-0.273
-1.0%
jan 1, 2000
26.859
-0.263
-0.97%
jan 1, 2001
26.656
-0.203
-0.76%
jan 1, 2002
26.712
+0.056
0.21%
jan 1, 2003
26.776
+0.064
0.24%
jan 1, 2004
26.857
+0.081
0.3%
jan 1, 2005
26.967
+0.11
0.41%
jan 1, 2006
27.111
+0.144
0.54%
jan 1, 2007
27.296
+0.185
0.68%
jan 1, 2008
27.516
+0.219
0.8%
jan 1, 2009
27.758
+0.242
0.88%
jan 1, 2010
28.003
+0.245
0.88%
jan 1, 2011
28.242
+0.239
0.85%
jan 1, 2012
28.451
+0.209
0.74%
jan 1, 2013
28.634
+0.183
0.64%
jan 1, 2014
28.794
+0.161
0.56%
jan 1, 2015
28.94
+0.145
0.5%
jan 1, 2016
28.973
+0.034
0.12%
Ranking of countries by current statistics by years


Comments: