29
/
en
AIzaSyAYiBZKx7MnpbEhh9jyipgxe19OcubqV5w
April 1, 2024
213457
Nigeria
NGA
true
2
1
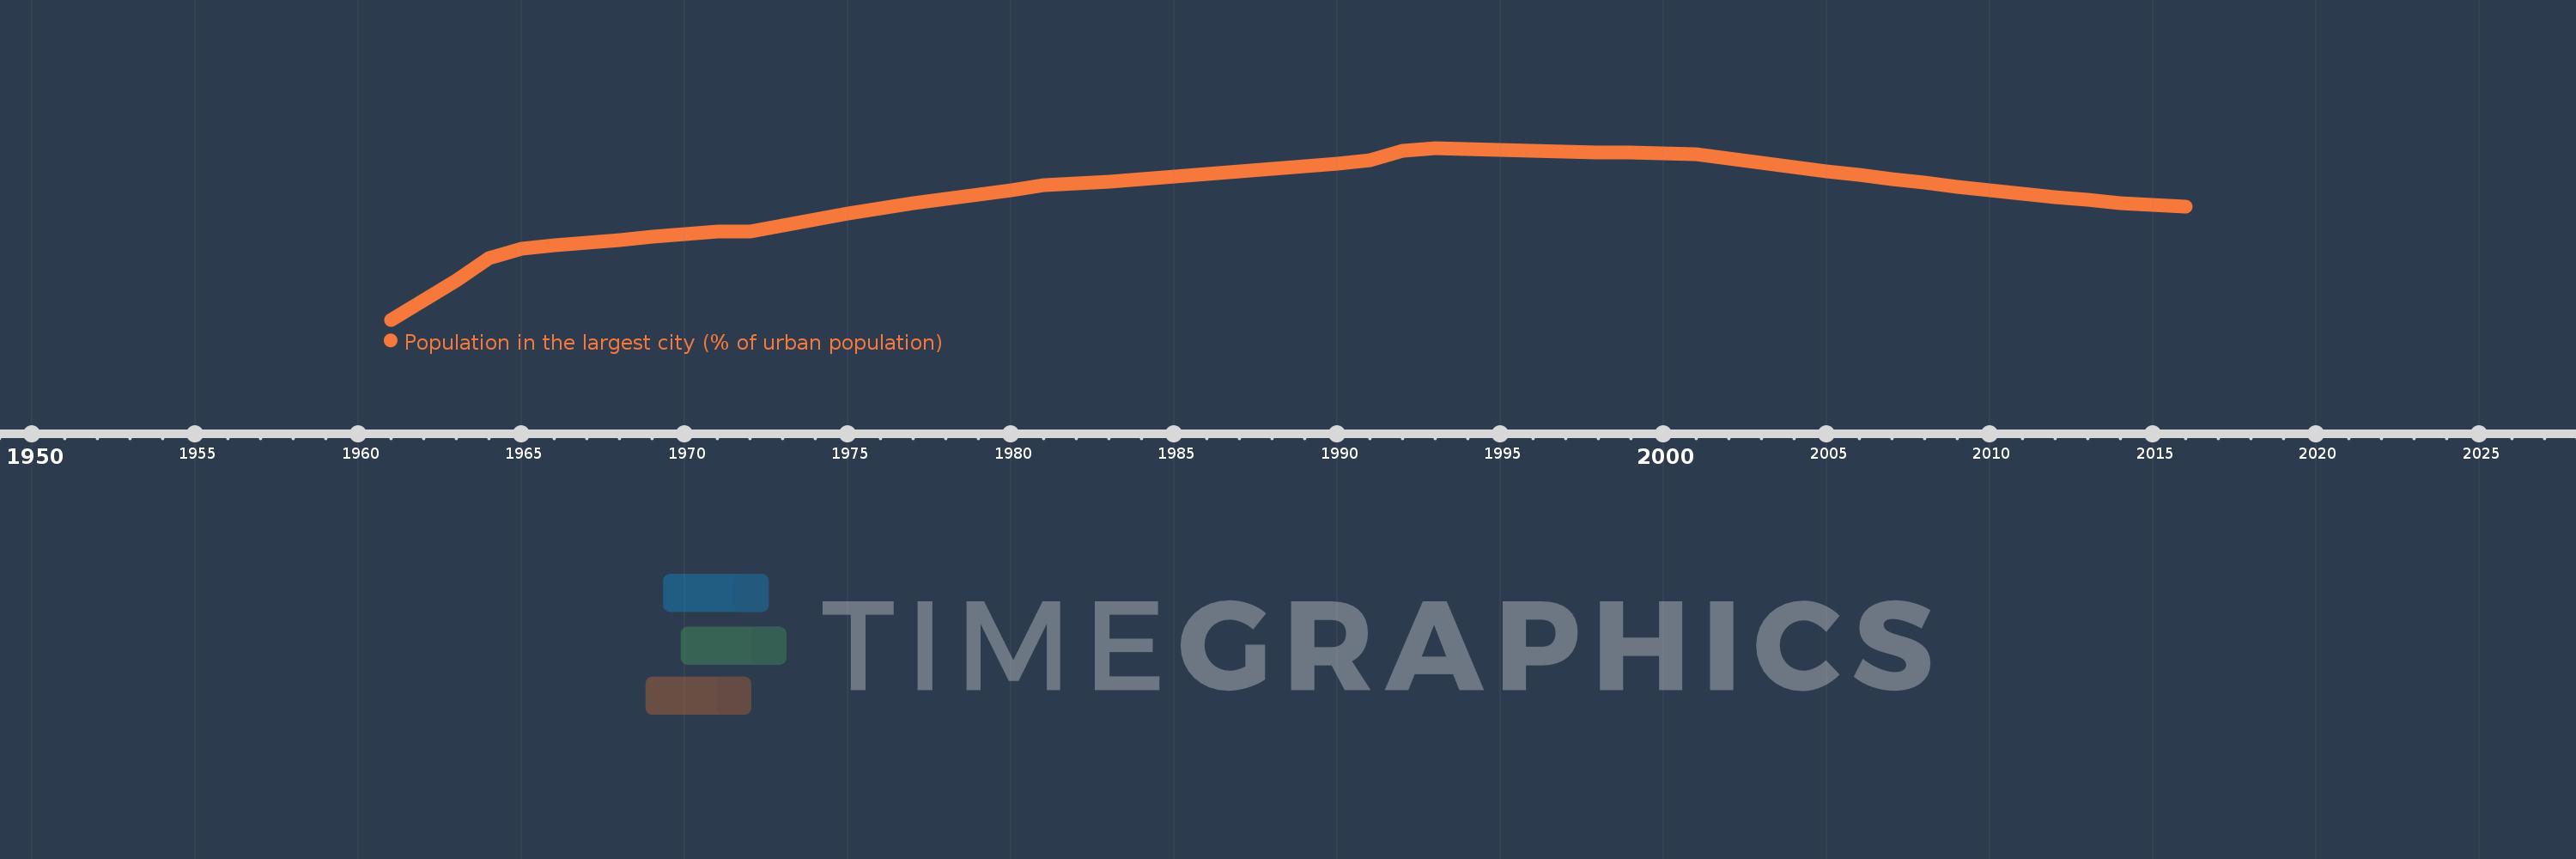
Population in the largest city (% of urban population)
2016,2015,2014,2013,2012,2011,2010,2009,2008,2007,2006,2005,2004,2003,2002,2001,2000,1999,1998,1997,1996,1995,1994,1993,1992,1991,1990,1989,1988,1987,1986,1985,1984,1983,1982,1981,1980,1979,1978,1977,1976,1975,1974,1973,1972,1971,1970,1969,1968,1967,1966,1965,1964,1963,1962,1961
This statistics in other country:
AfghanistanAlbaniaAlgeriaAngolaArab WorldArgentinaArmeniaAustraliaAustriaAzerbaijanBahrainBangladeshBelarusBelgiumBeninBoliviaBosnia and HerzegovinaBrazilBulgariaBurkina FasoBurundiCambodiaCameroonCanadaCentral African RepublicCentral Europe and the BalticsChadChileChinaColombiaCongo, Dem. Rep.Congo, Rep.Costa RicaCote d'IvoireCroatiaCubaCzech RepublicDenmarkDjiboutiDominican RepublicEarly-demographic dividendEast Asia & PacificEast Asia & Pacific (excluding high income)East Asia & Pacific (IDA & IBRD countries)EcuadorEgypt, Arab Rep.El SalvadorEritreaEstoniaEthiopiaEuro areaEurope & Central AsiaEurope & Central Asia (excluding high income)Europe & Central Asia (IDA & IBRD countries)European UnionFinlandFragile and conflict affected situationsFranceGabonGambia, TheGeorgiaGermanyGhanaGreeceGuatemalaGuineaGuinea-BissauHaitiHeavily indebted poor countries (HIPC)High incomeHondurasHong Kong SAR, ChinaHungaryIBRD onlyIDA & IBRD totalIDA blendIDA onlyIDA totalIndiaIndonesiaIran, Islamic Rep.IraqIrelandIsraelItalyJamaicaJapanJordanKazakhstanKenyaKorea, Dem. People’s Rep.Korea, Rep.KuwaitKyrgyz RepublicLao PDRLate-demographic dividendLatin America & Caribbean Latin America & Caribbean (excluding high income)Latin America & the Caribbean (IDA & IBRD countries)LatviaLeast developed countries: UN classificationLebanonLiberiaLibyaLithuaniaLow & middle incomeLow incomeLower middle incomeMacao SAR, ChinaMacedonia, FYRMadagascarMalawiMalaysiaMaliMauritaniaMexicoMiddle East & North AfricaMiddle East & North Africa (excluding high income)Middle East & North Africa (IDA & IBRD countries)Middle incomeMoldovaMongoliaMoroccoMozambiqueMyanmarNamibiaNepalNetherlandsNew ZealandNicaraguaNigerNigeriaNorth AmericaNorwayOECD membersOmanPakistanPanamaPapua New GuineaParaguayPeruPhilippinesPolandPortugalPost-demographic dividendPre-demographic dividendPuerto RicoQatarRomaniaRussian FederationRwandaSaudi ArabiaSenegalSerbiaSierra LeoneSingaporeSlovak RepublicSomaliaSouth AfricaSouth AsiaSouth Asia (IDA & IBRD)South SudanSpainSri LankaSub-Saharan Africa Sub-Saharan Africa (excluding high income)Sub-Saharan Africa (IDA & IBRD countries)SudanSwedenSwitzerlandSyrian Arab RepublicTajikistanTanzaniaThailandTogoTunisiaTurkeyTurkmenistanUgandaUkraineUnited Arab EmiratesUnited KingdomUnited StatesUpper middle incomeUruguayUzbekistanVenezuela, RBVietnamWest Bank and GazaWorldYemen, Rep.ZambiaZimbabwe Timeline:
This timeline shows a graph from 1961 to 2016 of Nigeria. No data until 1960. Number of actual observations by date: 56.
Source name:
World Development Indicators
Source organization:
United Nations, World Urbanization Prospects.
Categories, topics:
Urban Development
Last updated:
apr 23, 2017
Indicators value changes by year
Minimum:
10.943
jan 1, 1961
Maximum:
17.234
jan 1, 1993
At the date of observation
Value
Absolute change
Change from previous value
jan 1, 1961
10.943
+10.943
0.0%
jan 1, 1962
11.648
+0.705
6.45%
jan 1, 1963
12.396
+0.748
6.42%
jan 1, 1964
13.187
+0.791
6.38%
jan 1, 1965
13.546
+0.359
2.72%
jan 1, 1966
13.655
+0.11
0.81%
jan 1, 1967
13.765
+0.109
0.8%
jan 1, 1968
13.873
+0.109
0.79%
jan 1, 1969
13.98
+0.107
0.77%
jan 1, 1970
14.082
+0.102
0.73%
jan 1, 1971
14.179
+0.097
0.69%
jan 1, 1972
14.162
-0.018
-0.12%
jan 1, 1973
14.395
+0.234
1.65%
jan 1, 1974
14.622
+0.227
1.57%
jan 1, 1975
14.835
+0.213
1.46%
jan 1, 1976
15.03
+0.195
1.32%
jan 1, 1977
15.206
+0.175
1.17%
jan 1, 1978
15.364
+0.158
1.04%
jan 1, 1979
15.521
+0.157
1.02%
jan 1, 1980
15.692
+0.171
1.1%
jan 1, 1981
15.886
+0.195
1.24%
jan 1, 1982
15.933
+0.047
0.3%
jan 1, 1983
16.003
+0.07
0.44%
jan 1, 1984
16.09
+0.086
0.54%
jan 1, 1985
16.183
+0.093
0.58%
jan 1, 1986
16.275
+0.092
0.57%
jan 1, 1987
16.367
+0.092
0.56%
jan 1, 1988
16.46
+0.093
0.57%
jan 1, 1989
16.56
+0.1
0.61%
jan 1, 1990
16.667
+0.107
0.65%
jan 1, 1991
16.787
+0.12
0.72%
jan 1, 1992
17.119
+0.332
1.98%
jan 1, 1993
17.234
+0.115
0.67%
jan 1, 1994
17.197
-0.038
-0.22%
jan 1, 1995
17.164
-0.033
-0.19%
jan 1, 1996
17.133
-0.03
-0.18%
jan 1, 1997
17.105
-0.028
-0.17%
jan 1, 1998
17.078
-0.027
-0.16%
jan 1, 1999
17.053
-0.025
-0.14%
jan 1, 2000
17.03
-0.024
-0.14%
jan 1, 2001
17.007
-0.023
-0.13%
jan 1, 2002
16.846
-0.161
-0.95%
jan 1, 2003
16.69
-0.156
-0.93%
jan 1, 2004
16.537
-0.152
-0.91%
jan 1, 2005
16.388
-0.149
-0.9%
jan 1, 2006
16.24
-0.148
-0.9%
jan 1, 2007
16.096
-0.145
-0.89%
jan 1, 2008
15.954
-0.142
-0.88%
jan 1, 2009
15.817
-0.138
-0.86%
jan 1, 2010
15.682
-0.134
-0.85%
jan 1, 2011
15.553
-0.129
-0.82%
jan 1, 2012
15.433
-0.12
-0.77%
jan 1, 2013
15.325
-0.109
-0.71%
jan 1, 2014
15.226
-0.099
-0.64%
jan 1, 2015
15.14
-0.085
-0.56%
jan 1, 2016
15.075
-0.065
-0.43%
Ranking of countries by current statistics by years


Comments: