29
/
en
AIzaSyAYiBZKx7MnpbEhh9jyipgxe19OcubqV5w
April 1, 2024
133531
Finland
FIN
true
2
1
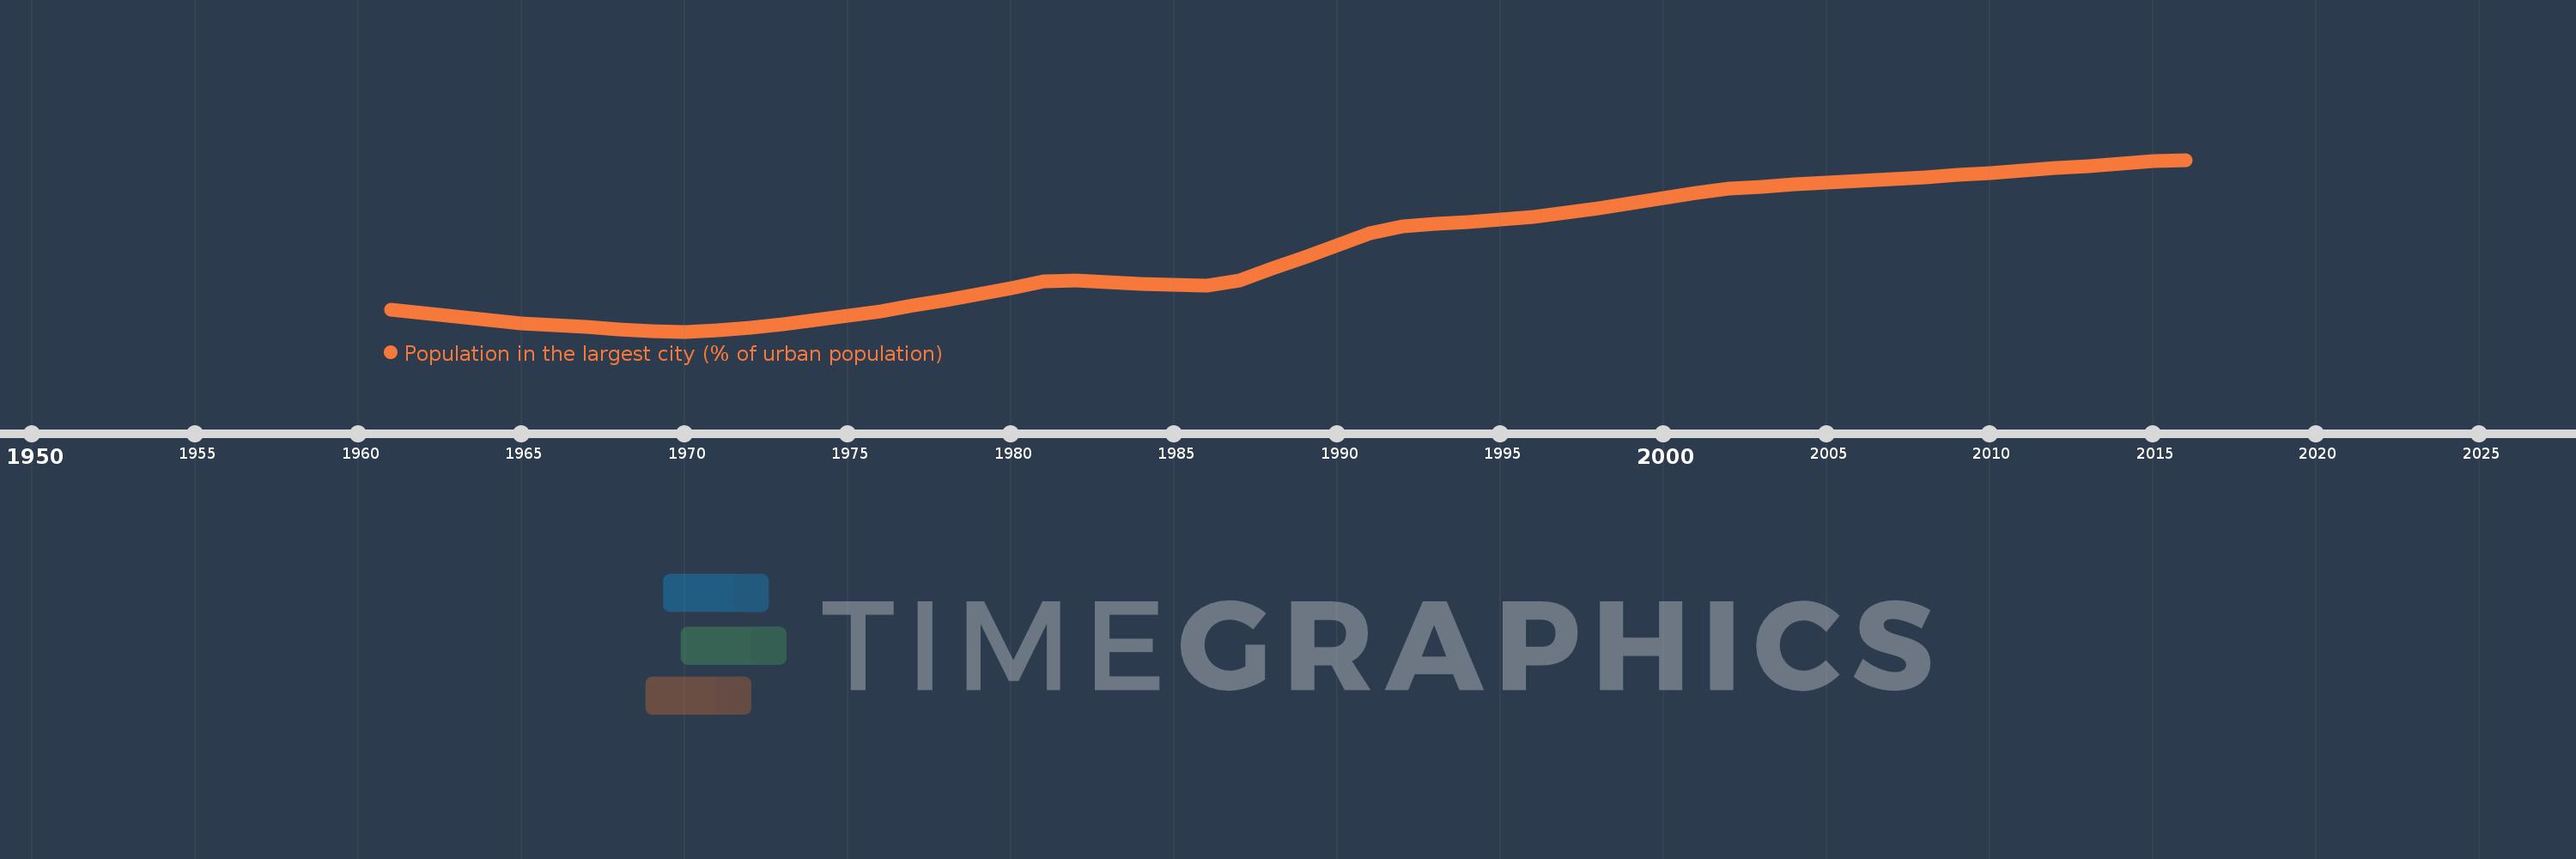
Population in the largest city (% of urban population)
2016,2015,2014,2013,2012,2011,2010,2009,2008,2007,2006,2005,2004,2003,2002,2001,2000,1999,1998,1997,1996,1995,1994,1993,1992,1991,1990,1989,1988,1987,1986,1985,1984,1983,1982,1981,1980,1979,1978,1977,1976,1975,1974,1973,1972,1971,1970,1969,1968,1967,1966,1965,1964,1963,1962,1961
This statistics in other country:
AfghanistanAlbaniaAlgeriaAngolaArab WorldArgentinaArmeniaAustraliaAustriaAzerbaijanBahrainBangladeshBelarusBelgiumBeninBoliviaBosnia and HerzegovinaBrazilBulgariaBurkina FasoBurundiCambodiaCameroonCanadaCentral African RepublicCentral Europe and the BalticsChadChileChinaColombiaCongo, Dem. Rep.Congo, Rep.Costa RicaCote d'IvoireCroatiaCubaCzech RepublicDenmarkDjiboutiDominican RepublicEarly-demographic dividendEast Asia & PacificEast Asia & Pacific (excluding high income)East Asia & Pacific (IDA & IBRD countries)EcuadorEgypt, Arab Rep.El SalvadorEritreaEstoniaEthiopiaEuro areaEurope & Central AsiaEurope & Central Asia (excluding high income)Europe & Central Asia (IDA & IBRD countries)European UnionFinlandFragile and conflict affected situationsFranceGabonGambia, TheGeorgiaGermanyGhanaGreeceGuatemalaGuineaGuinea-BissauHaitiHeavily indebted poor countries (HIPC)High incomeHondurasHong Kong SAR, ChinaHungaryIBRD onlyIDA & IBRD totalIDA blendIDA onlyIDA totalIndiaIndonesiaIran, Islamic Rep.IraqIrelandIsraelItalyJamaicaJapanJordanKazakhstanKenyaKorea, Dem. People’s Rep.Korea, Rep.KuwaitKyrgyz RepublicLao PDRLate-demographic dividendLatin America & Caribbean Latin America & Caribbean (excluding high income)Latin America & the Caribbean (IDA & IBRD countries)LatviaLeast developed countries: UN classificationLebanonLiberiaLibyaLithuaniaLow & middle incomeLow incomeLower middle incomeMacao SAR, ChinaMacedonia, FYRMadagascarMalawiMalaysiaMaliMauritaniaMexicoMiddle East & North AfricaMiddle East & North Africa (excluding high income)Middle East & North Africa (IDA & IBRD countries)Middle incomeMoldovaMongoliaMoroccoMozambiqueMyanmarNamibiaNepalNetherlandsNew ZealandNicaraguaNigerNigeriaNorth AmericaNorwayOECD membersOmanPakistanPanamaPapua New GuineaParaguayPeruPhilippinesPolandPortugalPost-demographic dividendPre-demographic dividendPuerto RicoQatarRomaniaRussian FederationRwandaSaudi ArabiaSenegalSerbiaSierra LeoneSingaporeSlovak RepublicSomaliaSouth AfricaSouth AsiaSouth Asia (IDA & IBRD)South SudanSpainSri LankaSub-Saharan Africa Sub-Saharan Africa (excluding high income)Sub-Saharan Africa (IDA & IBRD countries)SudanSwedenSwitzerlandSyrian Arab RepublicTajikistanTanzaniaThailandTogoTunisiaTurkeyTurkmenistanUgandaUkraineUnited Arab EmiratesUnited KingdomUnited StatesUpper middle incomeUruguayUzbekistanVenezuela, RBVietnamWest Bank and GazaWorldYemen, Rep.ZambiaZimbabwe Timeline:
This timeline shows a graph from 1961 to 2016 of Finland. No data until 1960. Number of actual observations by date: 56.
Source name:
World Development Indicators
Source organization:
United Nations, World Urbanization Prospects.
Categories, topics:
Urban Development
Last updated:
apr 23, 2017
Indicators value changes by year
Minimum:
17.233
jan 1, 1970
Maximum:
25.556
jan 1, 2016
At the date of observation
Value
Absolute change
Change from previous value
jan 1, 1961
18.3
+18.3
0.0%
jan 1, 1962
18.129
-0.171
-0.93%
jan 1, 1963
17.955
-0.174
-0.96%
jan 1, 1964
17.783
-0.172
-0.96%
jan 1, 1965
17.644
-0.139
-0.78%
jan 1, 1966
17.55
-0.094
-0.53%
jan 1, 1967
17.455
-0.096
-0.54%
jan 1, 1968
17.336
-0.119
-0.68%
jan 1, 1969
17.238
-0.098
-0.56%
jan 1, 1970
17.233
-0.005
-0.03%
jan 1, 1971
17.288
+0.055
0.32%
jan 1, 1972
17.402
+0.114
0.66%
jan 1, 1973
17.583
+0.181
1.04%
jan 1, 1974
17.776
+0.193
1.1%
jan 1, 1975
17.984
+0.209
1.17%
jan 1, 1976
18.215
+0.231
1.29%
jan 1, 1977
18.482
+0.266
1.46%
jan 1, 1978
18.761
+0.279
1.51%
jan 1, 1979
19.049
+0.288
1.53%
jan 1, 1980
19.352
+0.304
1.59%
jan 1, 1981
19.656
+0.304
1.57%
jan 1, 1982
19.718
+0.062
0.32%
jan 1, 1983
19.638
-0.08
-0.41%
jan 1, 1984
19.558
-0.08
-0.41%
jan 1, 1985
19.497
-0.061
-0.31%
jan 1, 1986
19.466
-0.031
-0.16%
jan 1, 1987
19.726
+0.26
1.33%
jan 1, 1988
20.278
+0.553
2.8%
jan 1, 1989
20.852
+0.574
2.83%
jan 1, 1990
21.431
+0.579
2.78%
jan 1, 1991
22.015
+0.584
2.73%
jan 1, 1992
22.35
+0.335
1.52%
jan 1, 1993
22.439
+0.089
0.4%
jan 1, 1994
22.546
+0.107
0.48%
jan 1, 1995
22.667
+0.121
0.54%
jan 1, 1996
22.801
+0.134
0.59%
jan 1, 1997
22.984
+0.183
0.8%
jan 1, 1998
23.212
+0.227
0.99%
jan 1, 1999
23.45
+0.238
1.03%
jan 1, 2000
23.7
+0.25
1.06%
jan 1, 2001
23.959
+0.259
1.09%
jan 1, 2002
24.142
+0.183
0.76%
jan 1, 2003
24.248
+0.106
0.44%
jan 1, 2004
24.355
+0.107
0.44%
jan 1, 2005
24.451
+0.096
0.39%
jan 1, 2006
24.534
+0.083
0.34%
jan 1, 2007
24.619
+0.085
0.35%
jan 1, 2008
24.705
+0.086
0.35%
jan 1, 2009
24.81
+0.105
0.42%
jan 1, 2010
24.926
+0.116
0.47%
jan 1, 2011
25.035
+0.109
0.44%
jan 1, 2012
25.142
+0.107
0.43%
jan 1, 2013
25.247
+0.104
0.42%
jan 1, 2014
25.355
+0.108
0.43%
jan 1, 2015
25.475
+0.12
0.47%
jan 1, 2016
25.556
+0.081
0.32%
Ranking of countries by current statistics by years


Comments: