29
/
en
AIzaSyAYiBZKx7MnpbEhh9jyipgxe19OcubqV5w
April 1, 2024
212185
Niger
NER
true
2
1
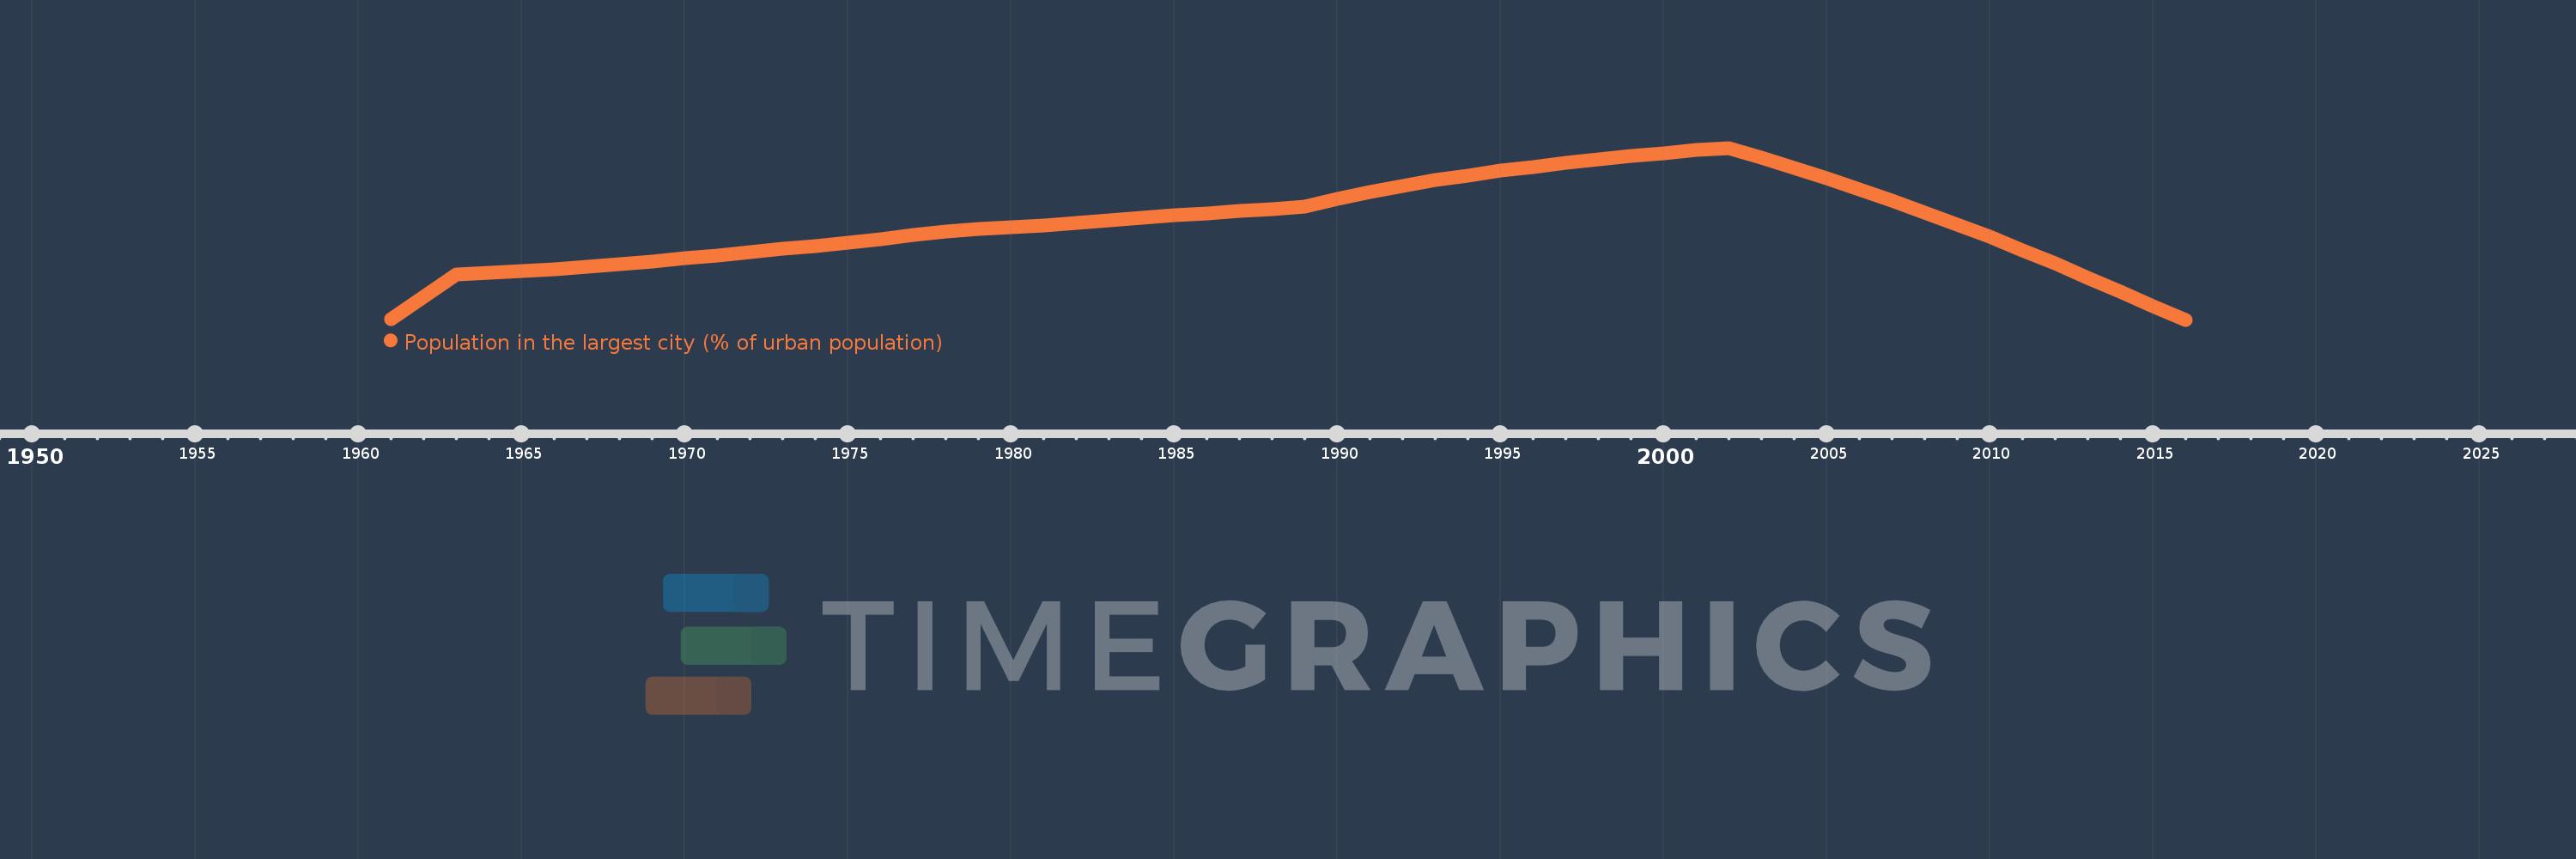
Population in the largest city (% of urban population)
2016,2015,2014,2013,2012,2011,2010,2009,2008,2007,2006,2005,2004,2003,2002,2001,2000,1999,1998,1997,1996,1995,1994,1993,1992,1991,1990,1989,1988,1987,1986,1985,1984,1983,1982,1981,1980,1979,1978,1977,1976,1975,1974,1973,1972,1971,1970,1969,1968,1967,1966,1965,1964,1963,1962,1961
This statistics in other country:
AfghanistanAlbaniaAlgeriaAngolaArab WorldArgentinaArmeniaAustraliaAustriaAzerbaijanBahrainBangladeshBelarusBelgiumBeninBoliviaBosnia and HerzegovinaBrazilBulgariaBurkina FasoBurundiCambodiaCameroonCanadaCentral African RepublicCentral Europe and the BalticsChadChileChinaColombiaCongo, Dem. Rep.Congo, Rep.Costa RicaCote d'IvoireCroatiaCubaCzech RepublicDenmarkDjiboutiDominican RepublicEarly-demographic dividendEast Asia & PacificEast Asia & Pacific (excluding high income)East Asia & Pacific (IDA & IBRD countries)EcuadorEgypt, Arab Rep.El SalvadorEritreaEstoniaEthiopiaEuro areaEurope & Central AsiaEurope & Central Asia (excluding high income)Europe & Central Asia (IDA & IBRD countries)European UnionFinlandFragile and conflict affected situationsFranceGabonGambia, TheGeorgiaGermanyGhanaGreeceGuatemalaGuineaGuinea-BissauHaitiHeavily indebted poor countries (HIPC)High incomeHondurasHong Kong SAR, ChinaHungaryIBRD onlyIDA & IBRD totalIDA blendIDA onlyIDA totalIndiaIndonesiaIran, Islamic Rep.IraqIrelandIsraelItalyJamaicaJapanJordanKazakhstanKenyaKorea, Dem. People’s Rep.Korea, Rep.KuwaitKyrgyz RepublicLao PDRLate-demographic dividendLatin America & Caribbean Latin America & Caribbean (excluding high income)Latin America & the Caribbean (IDA & IBRD countries)LatviaLeast developed countries: UN classificationLebanonLiberiaLibyaLithuaniaLow & middle incomeLow incomeLower middle incomeMacao SAR, ChinaMacedonia, FYRMadagascarMalawiMalaysiaMaliMauritaniaMexicoMiddle East & North AfricaMiddle East & North Africa (excluding high income)Middle East & North Africa (IDA & IBRD countries)Middle incomeMoldovaMongoliaMoroccoMozambiqueMyanmarNamibiaNepalNetherlandsNew ZealandNicaraguaNigerNigeriaNorth AmericaNorwayOECD membersOmanPakistanPanamaPapua New GuineaParaguayPeruPhilippinesPolandPortugalPost-demographic dividendPre-demographic dividendPuerto RicoQatarRomaniaRussian FederationRwandaSaudi ArabiaSenegalSerbiaSierra LeoneSingaporeSlovak RepublicSomaliaSouth AfricaSouth AsiaSouth Asia (IDA & IBRD)South SudanSpainSri LankaSub-Saharan Africa Sub-Saharan Africa (excluding high income)Sub-Saharan Africa (IDA & IBRD countries)SudanSwedenSwitzerlandSyrian Arab RepublicTajikistanTanzaniaThailandTogoTunisiaTurkeyTurkmenistanUgandaUkraineUnited Arab EmiratesUnited KingdomUnited StatesUpper middle incomeUruguayUzbekistanVenezuela, RBVietnamWest Bank and GazaWorldYemen, Rep.ZambiaZimbabwe Timeline:
This timeline shows a graph from 1961 to 2016 of Niger. No data until 1960. Number of actual observations by date: 56.
Source name:
World Development Indicators
Source organization:
United Nations, World Urbanization Prospects.
Categories, topics:
Urban Development
Last updated:
apr 23, 2017
Indicators value changes by year
Minimum:
29.231
jan 1, 2016
Maximum:
38.403
jan 1, 2002
At the date of observation
Value
Absolute change
Change from previous value
jan 1, 1961
29.259
+29.259
0.0%
jan 1, 1962
30.441
+1.182
4.04%
jan 1, 1963
31.664
+1.223
4.02%
jan 1, 1964
31.738
+0.075
0.24%
jan 1, 1965
31.826
+0.088
0.28%
jan 1, 1966
31.932
+0.106
0.33%
jan 1, 1967
32.064
+0.132
0.41%
jan 1, 1968
32.199
+0.135
0.42%
jan 1, 1969
32.352
+0.153
0.48%
jan 1, 1970
32.509
+0.156
0.48%
jan 1, 1971
32.67
+0.161
0.5%
jan 1, 1972
32.836
+0.166
0.51%
jan 1, 1973
33.008
+0.173
0.53%
jan 1, 1974
33.181
+0.173
0.52%
jan 1, 1975
33.362
+0.18
0.54%
jan 1, 1976
33.549
+0.187
0.56%
jan 1, 1977
33.739
+0.19
0.57%
jan 1, 1978
33.932
+0.194
0.57%
jan 1, 1979
34.06
+0.128
0.38%
jan 1, 1980
34.149
+0.088
0.26%
jan 1, 1981
34.258
+0.11
0.32%
jan 1, 1982
34.38
+0.121
0.35%
jan 1, 1983
34.516
+0.137
0.4%
jan 1, 1984
34.655
+0.139
0.4%
jan 1, 1985
34.795
+0.139
0.4%
jan 1, 1986
34.923
+0.129
0.37%
jan 1, 1987
35.045
+0.122
0.35%
jan 1, 1988
35.155
+0.11
0.31%
jan 1, 1989
35.283
+0.128
0.36%
jan 1, 1990
35.677
+0.394
1.12%
jan 1, 1991
36.043
+0.366
1.03%
jan 1, 1992
36.37
+0.327
0.91%
jan 1, 1993
36.67
+0.3
0.83%
jan 1, 1994
36.935
+0.265
0.72%
jan 1, 1995
37.178
+0.243
0.66%
jan 1, 1996
37.4
+0.222
0.6%
jan 1, 1997
37.605
+0.205
0.55%
jan 1, 1998
37.789
+0.184
0.49%
jan 1, 1999
37.962
+0.173
0.46%
jan 1, 2000
38.133
+0.171
0.45%
jan 1, 2001
38.309
+0.176
0.46%
jan 1, 2002
38.403
+0.094
0.25%
jan 1, 2003
37.884
-0.519
-1.35%
jan 1, 2004
37.346
-0.538
-1.42%
jan 1, 2005
36.784
-0.562
-1.5%
jan 1, 2006
36.199
-0.585
-1.59%
jan 1, 2007
35.594
-0.605
-1.67%
jan 1, 2008
34.971
-0.624
-1.75%
jan 1, 2009
34.326
-0.644
-1.84%
jan 1, 2010
33.65
-0.677
-1.97%
jan 1, 2011
32.949
-0.701
-2.08%
jan 1, 2012
32.222
-0.727
-2.21%
jan 1, 2013
31.478
-0.744
-2.31%
jan 1, 2014
30.72
-0.758
-2.41%
jan 1, 2015
29.958
-0.762
-2.48%
jan 1, 2016
29.231
-0.727
-2.43%
Ranking of countries by current statistics by years


Comments: