29
/
en
AIzaSyAYiBZKx7MnpbEhh9jyipgxe19OcubqV5w
April 1, 2024
40993
Late-demographic dividend
LTE
false
2
1
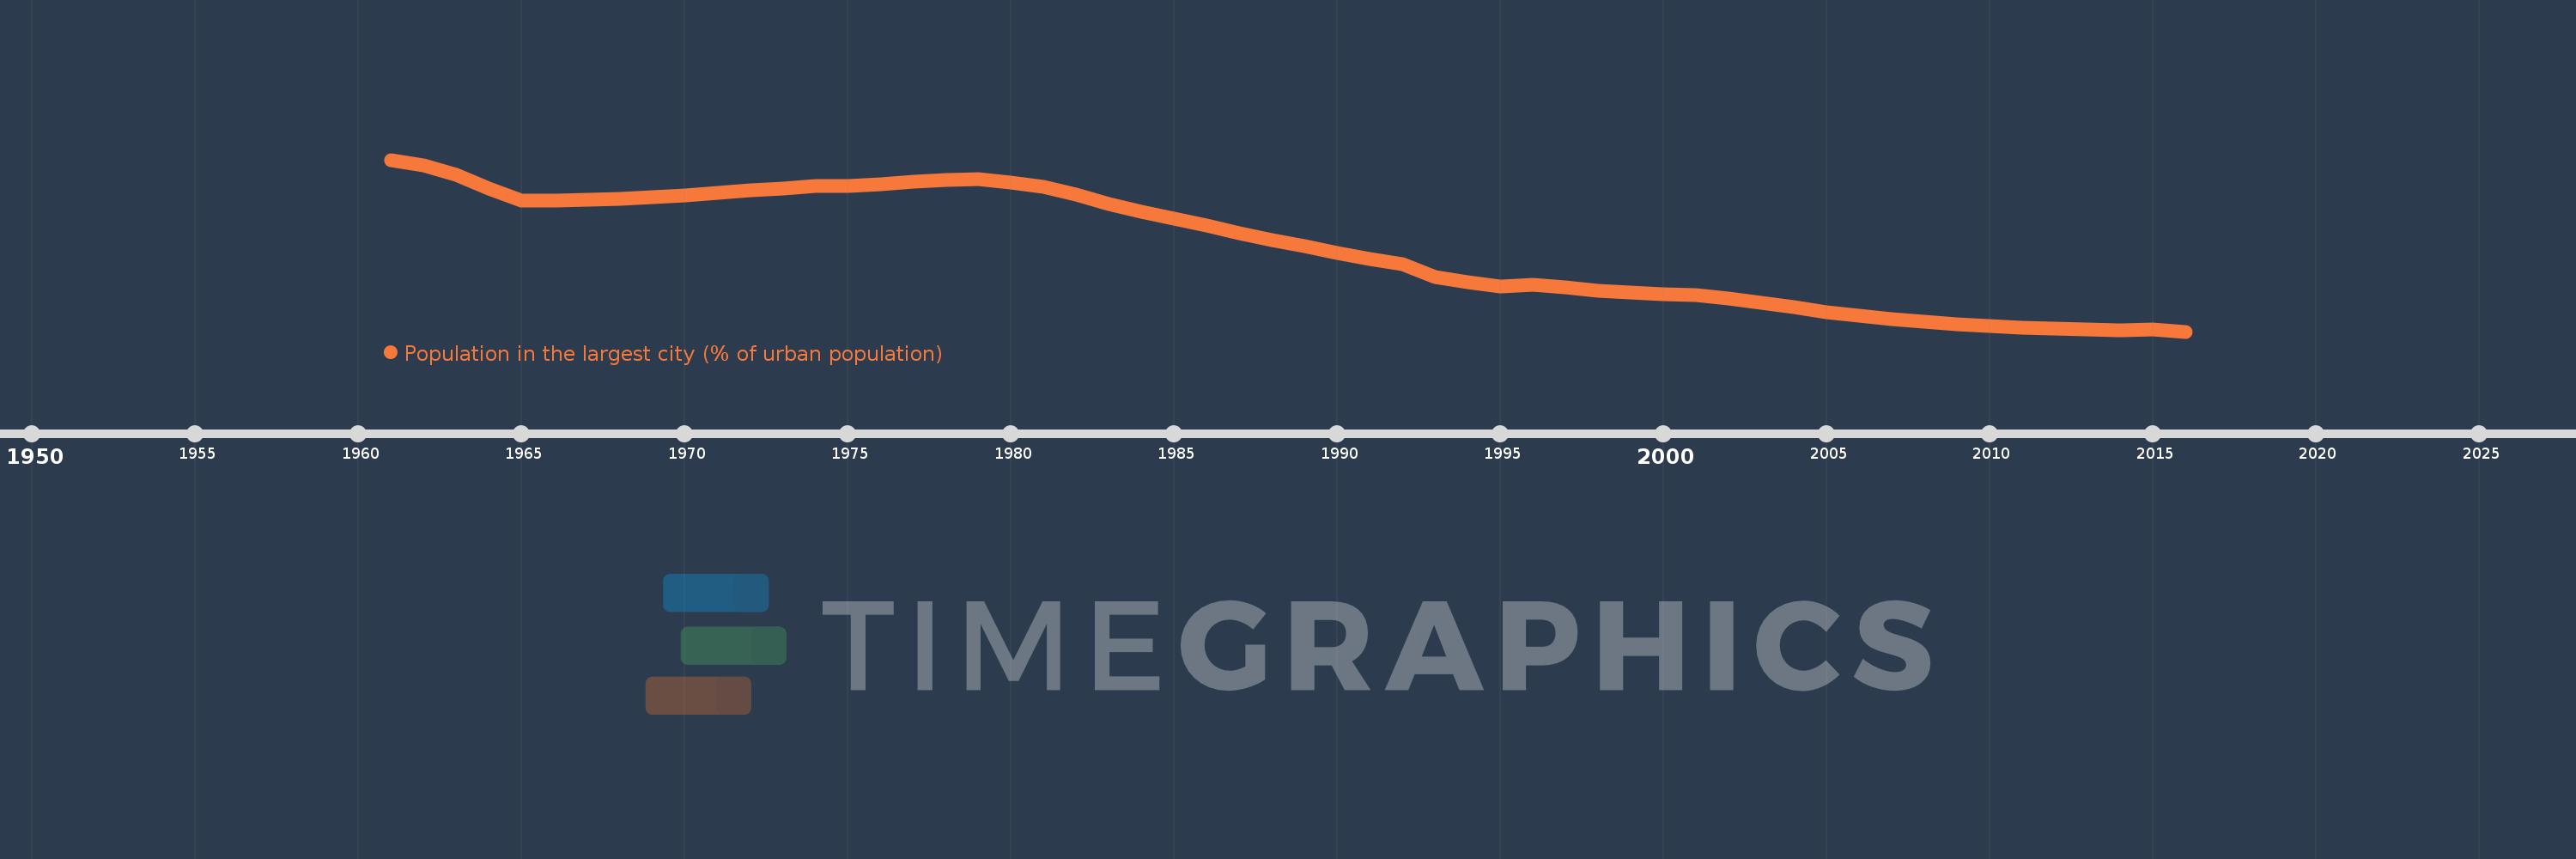
Population in the largest city (% of urban population)
2016,2015,2014,2013,2012,2011,2010,2009,2008,2007,2006,2005,2004,2003,2002,2001,2000,1999,1998,1997,1996,1995,1994,1993,1992,1991,1990,1989,1988,1987,1986,1985,1984,1983,1982,1981,1980,1979,1978,1977,1976,1975,1974,1973,1972,1971,1970,1969,1968,1967,1966,1965,1964,1963,1962,1961
This statistics in other country:
AfghanistanAlbaniaAlgeriaAngolaArab WorldArgentinaArmeniaAustraliaAustriaAzerbaijanBahrainBangladeshBelarusBelgiumBeninBoliviaBosnia and HerzegovinaBrazilBulgariaBurkina FasoBurundiCambodiaCameroonCanadaCentral African RepublicCentral Europe and the BalticsChadChileChinaColombiaCongo, Dem. Rep.Congo, Rep.Costa RicaCote d'IvoireCroatiaCubaCzech RepublicDenmarkDjiboutiDominican RepublicEarly-demographic dividendEast Asia & PacificEast Asia & Pacific (excluding high income)East Asia & Pacific (IDA & IBRD countries)EcuadorEgypt, Arab Rep.El SalvadorEritreaEstoniaEthiopiaEuro areaEurope & Central AsiaEurope & Central Asia (excluding high income)Europe & Central Asia (IDA & IBRD countries)European UnionFinlandFragile and conflict affected situationsFranceGabonGambia, TheGeorgiaGermanyGhanaGreeceGuatemalaGuineaGuinea-BissauHaitiHeavily indebted poor countries (HIPC)High incomeHondurasHong Kong SAR, ChinaHungaryIBRD onlyIDA & IBRD totalIDA blendIDA onlyIDA totalIndiaIndonesiaIran, Islamic Rep.IraqIrelandIsraelItalyJamaicaJapanJordanKazakhstanKenyaKorea, Dem. People’s Rep.Korea, Rep.KuwaitKyrgyz RepublicLao PDRLate-demographic dividendLatin America & Caribbean Latin America & Caribbean (excluding high income)Latin America & the Caribbean (IDA & IBRD countries)LatviaLeast developed countries: UN classificationLebanonLiberiaLibyaLithuaniaLow & middle incomeLow incomeLower middle incomeMacao SAR, ChinaMacedonia, FYRMadagascarMalawiMalaysiaMaliMauritaniaMexicoMiddle East & North AfricaMiddle East & North Africa (excluding high income)Middle East & North Africa (IDA & IBRD countries)Middle incomeMoldovaMongoliaMoroccoMozambiqueMyanmarNamibiaNepalNetherlandsNew ZealandNicaraguaNigerNigeriaNorth AmericaNorwayOECD membersOmanPakistanPanamaPapua New GuineaParaguayPeruPhilippinesPolandPortugalPost-demographic dividendPre-demographic dividendPuerto RicoQatarRomaniaRussian FederationRwandaSaudi ArabiaSenegalSerbiaSierra LeoneSingaporeSlovak RepublicSomaliaSouth AfricaSouth AsiaSouth Asia (IDA & IBRD)South SudanSpainSri LankaSub-Saharan Africa Sub-Saharan Africa (excluding high income)Sub-Saharan Africa (IDA & IBRD countries)SudanSwedenSwitzerlandSyrian Arab RepublicTajikistanTanzaniaThailandTogoTunisiaTurkeyTurkmenistanUgandaUkraineUnited Arab EmiratesUnited KingdomUnited StatesUpper middle incomeUruguayUzbekistanVenezuela, RBVietnamWest Bank and GazaWorldYemen, Rep.ZambiaZimbabwe Timeline:
This timeline shows a graph from 1961 to 2016 of Late-demographic dividend. No data until 1960. Number of actual observations by date: 56.
Source name:
World Development Indicators
Source organization:
United Nations, World Urbanization Prospects.
Categories, topics:
Urban Development
Last updated:
apr 23, 2017
Indicators value changes by year
Minimum:
10.279
jan 1, 2016
Maximum:
13.608
jan 1, 1961
At the date of observation
Value
Absolute change
Change from previous value
jan 1, 1961
13.608
+13.608
0.0%
jan 1, 1962
13.502
-0.106
-0.78%
jan 1, 1963
13.315
-0.187
-1.39%
jan 1, 1964
13.058
-0.257
-1.93%
jan 1, 1965
12.818
-0.24
-1.84%
jan 1, 1966
12.82
+0.002
0.01%
jan 1, 1967
12.834
+0.014
0.11%
jan 1, 1968
12.855
+0.021
0.16%
jan 1, 1969
12.886
+0.031
0.24%
jan 1, 1970
12.925
+0.039
0.3%
jan 1, 1971
12.975
+0.05
0.38%
jan 1, 1972
13.011
+0.036
0.28%
jan 1, 1973
13.057
+0.047
0.36%
jan 1, 1974
13.094
+0.037
0.28%
jan 1, 1975
13.108
+0.014
0.11%
jan 1, 1976
13.141
+0.033
0.25%
jan 1, 1977
13.176
+0.036
0.27%
jan 1, 1978
13.221
+0.045
0.34%
jan 1, 1979
13.234
+0.013
0.1%
jan 1, 1980
13.162
-0.072
-0.54%
jan 1, 1981
13.078
-0.084
-0.64%
jan 1, 1982
12.926
-0.151
-1.16%
jan 1, 1983
12.754
-0.172
-1.33%
jan 1, 1984
12.604
-0.151
-1.18%
jan 1, 1985
12.463
-0.141
-1.12%
jan 1, 1986
12.327
-0.137
-1.1%
jan 1, 1987
12.192
-0.135
-1.09%
jan 1, 1988
12.059
-0.133
-1.09%
jan 1, 1989
11.93
-0.128
-1.06%
jan 1, 1990
11.803
-0.127
-1.07%
jan 1, 1991
11.692
-0.112
-0.94%
jan 1, 1992
11.58
-0.112
-0.96%
jan 1, 1993
11.328
-0.252
-2.18%
jan 1, 1994
11.24
-0.088
-0.77%
jan 1, 1995
11.16
-0.081
-0.72%
jan 1, 1996
11.193
+0.033
0.3%
jan 1, 1997
11.13
-0.063
-0.57%
jan 1, 1998
11.076
-0.054
-0.49%
jan 1, 1999
11.034
-0.042
-0.38%
jan 1, 2000
11.003
-0.031
-0.28%
jan 1, 2001
10.985
-0.017
-0.16%
jan 1, 2002
10.918
-0.068
-0.62%
jan 1, 2003
10.838
-0.08
-0.73%
jan 1, 2004
10.747
-0.091
-0.84%
jan 1, 2005
10.661
-0.086
-0.8%
jan 1, 2006
10.582
-0.079
-0.74%
jan 1, 2007
10.52
-0.062
-0.59%
jan 1, 2008
10.469
-0.051
-0.49%
jan 1, 2009
10.424
-0.045
-0.43%
jan 1, 2010
10.385
-0.039
-0.37%
jan 1, 2011
10.355
-0.03
-0.29%
jan 1, 2012
10.331
-0.024
-0.24%
jan 1, 2013
10.315
-0.016
-0.15%
jan 1, 2014
10.309
-0.006
-0.06%
jan 1, 2015
10.313
+0.004
0.04%
jan 1, 2016
10.279
-0.034
-0.33%
Ranking of countries by current statistics by years


Comments: