29
/
en
AIzaSyAYiBZKx7MnpbEhh9jyipgxe19OcubqV5w
April 1, 2024
281485
Venezuela, RB
VEN
true
2
1
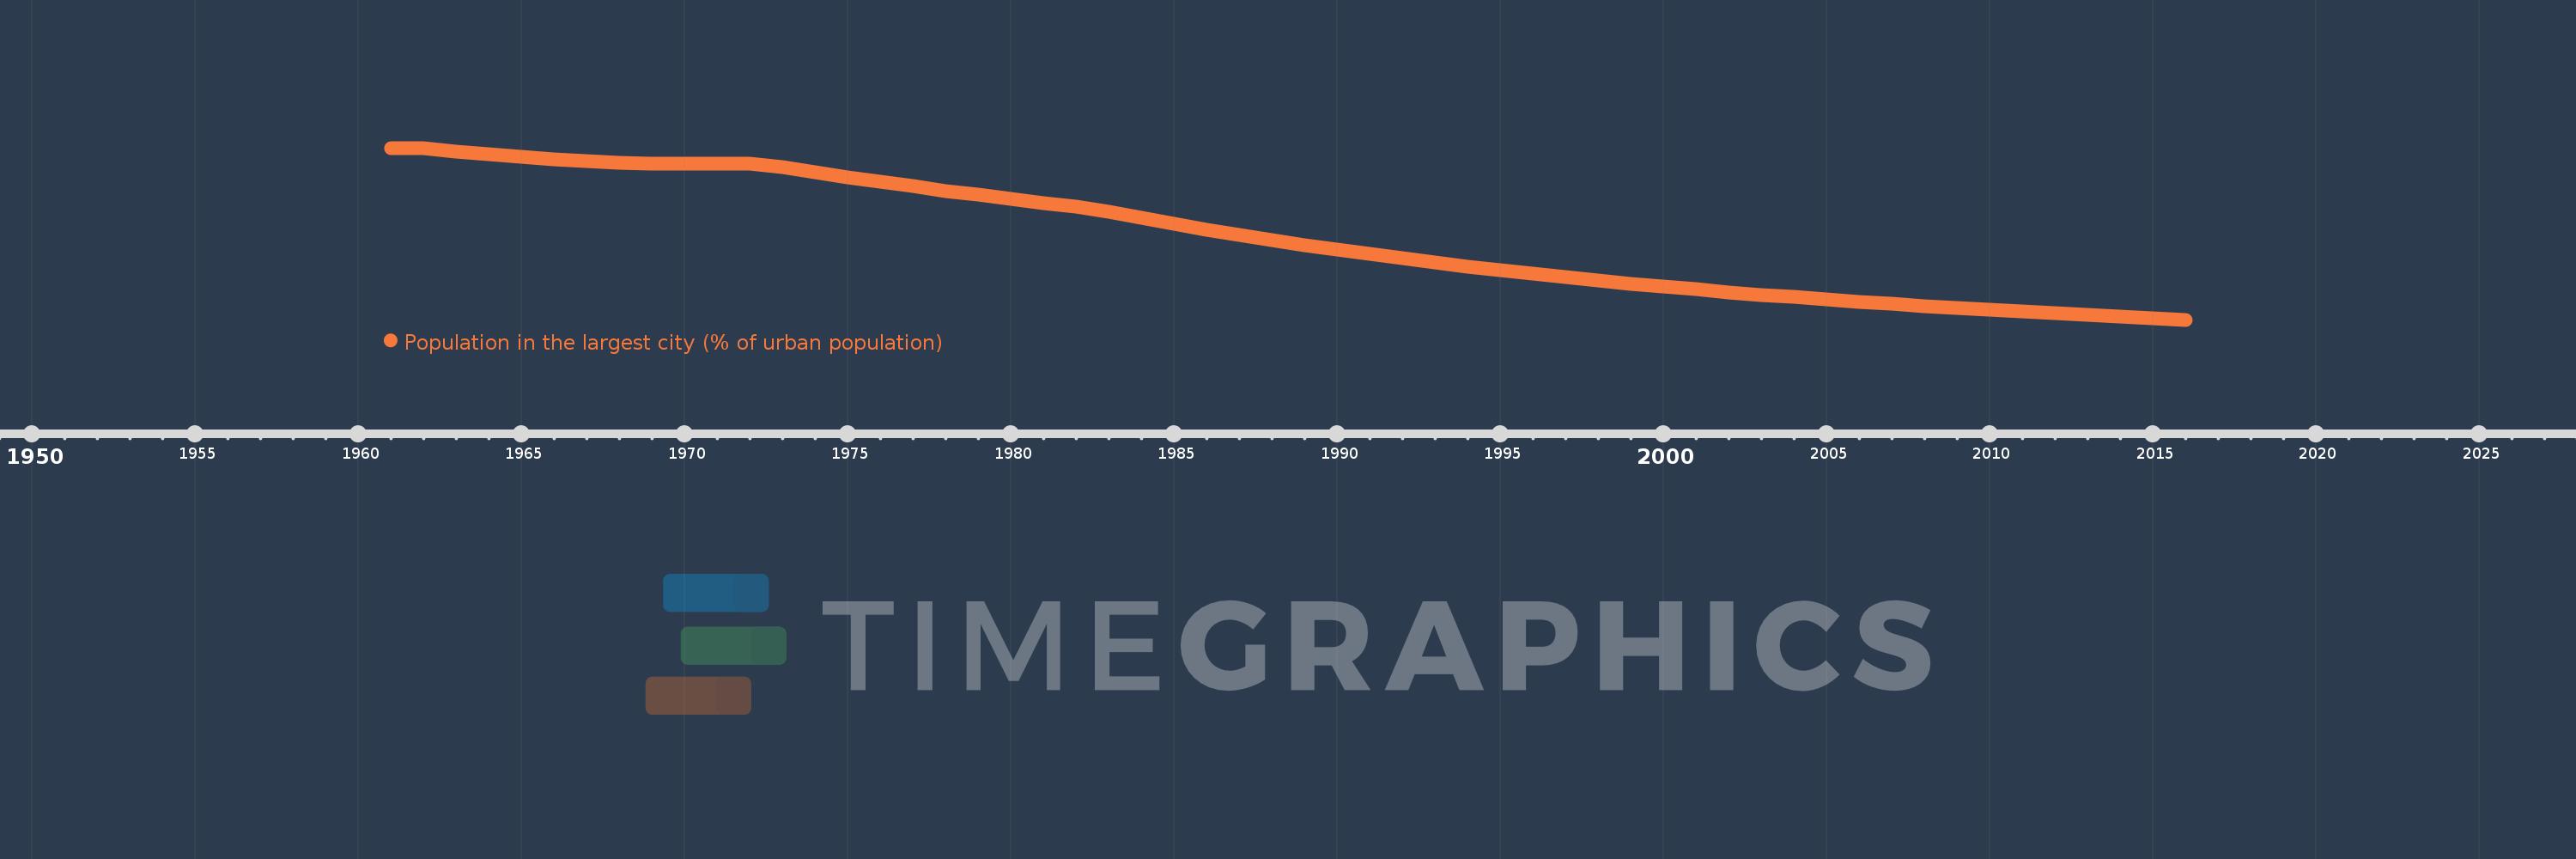
Population in the largest city (% of urban population)
2016,2015,2014,2013,2012,2011,2010,2009,2008,2007,2006,2005,2004,2003,2002,2001,2000,1999,1998,1997,1996,1995,1994,1993,1992,1991,1990,1989,1988,1987,1986,1985,1984,1983,1982,1981,1980,1979,1978,1977,1976,1975,1974,1973,1972,1971,1970,1969,1968,1967,1966,1965,1964,1963,1962,1961
This statistics in other country:
AfghanistanAlbaniaAlgeriaAngolaArab WorldArgentinaArmeniaAustraliaAustriaAzerbaijanBahrainBangladeshBelarusBelgiumBeninBoliviaBosnia and HerzegovinaBrazilBulgariaBurkina FasoBurundiCambodiaCameroonCanadaCentral African RepublicCentral Europe and the BalticsChadChileChinaColombiaCongo, Dem. Rep.Congo, Rep.Costa RicaCote d'IvoireCroatiaCubaCzech RepublicDenmarkDjiboutiDominican RepublicEarly-demographic dividendEast Asia & PacificEast Asia & Pacific (excluding high income)East Asia & Pacific (IDA & IBRD countries)EcuadorEgypt, Arab Rep.El SalvadorEritreaEstoniaEthiopiaEuro areaEurope & Central AsiaEurope & Central Asia (excluding high income)Europe & Central Asia (IDA & IBRD countries)European UnionFinlandFragile and conflict affected situationsFranceGabonGambia, TheGeorgiaGermanyGhanaGreeceGuatemalaGuineaGuinea-BissauHaitiHeavily indebted poor countries (HIPC)High incomeHondurasHong Kong SAR, ChinaHungaryIBRD onlyIDA & IBRD totalIDA blendIDA onlyIDA totalIndiaIndonesiaIran, Islamic Rep.IraqIrelandIsraelItalyJamaicaJapanJordanKazakhstanKenyaKorea, Dem. People’s Rep.Korea, Rep.KuwaitKyrgyz RepublicLao PDRLate-demographic dividendLatin America & Caribbean Latin America & Caribbean (excluding high income)Latin America & the Caribbean (IDA & IBRD countries)LatviaLeast developed countries: UN classificationLebanonLiberiaLibyaLithuaniaLow & middle incomeLow incomeLower middle incomeMacao SAR, ChinaMacedonia, FYRMadagascarMalawiMalaysiaMaliMauritaniaMexicoMiddle East & North AfricaMiddle East & North Africa (excluding high income)Middle East & North Africa (IDA & IBRD countries)Middle incomeMoldovaMongoliaMoroccoMozambiqueMyanmarNamibiaNepalNetherlandsNew ZealandNicaraguaNigerNigeriaNorth AmericaNorwayOECD membersOmanPakistanPanamaPapua New GuineaParaguayPeruPhilippinesPolandPortugalPost-demographic dividendPre-demographic dividendPuerto RicoQatarRomaniaRussian FederationRwandaSaudi ArabiaSenegalSerbiaSierra LeoneSingaporeSlovak RepublicSomaliaSouth AfricaSouth AsiaSouth Asia (IDA & IBRD)South SudanSpainSri LankaSub-Saharan Africa Sub-Saharan Africa (excluding high income)Sub-Saharan Africa (IDA & IBRD countries)SudanSwedenSwitzerlandSyrian Arab RepublicTajikistanTanzaniaThailandTogoTunisiaTurkeyTurkmenistanUgandaUkraineUnited Arab EmiratesUnited KingdomUnited StatesUpper middle incomeUruguayUzbekistanVenezuela, RBVietnamWest Bank and GazaWorldYemen, Rep.ZambiaZimbabwe Timeline:
This timeline shows a graph from 1961 to 2016 of Venezuela, RB. No data until 1960. Number of actual observations by date: 56.
Source name:
World Development Indicators
Source organization:
United Nations, World Urbanization Prospects.
Categories, topics:
Urban Development
Last updated:
apr 23, 2017
Indicators value changes by year
Minimum:
10.534
jan 1, 2016
Maximum:
26.208
jan 1, 1961
At the date of observation
Value
Absolute change
Change from previous value
jan 1, 1961
26.208
+26.208
0.0%
jan 1, 1962
26.174
-0.035
-0.13%
jan 1, 1963
25.88
-0.294
-1.12%
jan 1, 1964
25.607
-0.273
-1.05%
jan 1, 1965
25.368
-0.239
-0.93%
jan 1, 1966
25.169
-0.199
-0.78%
jan 1, 1967
25.01
-0.159
-0.63%
jan 1, 1968
24.888
-0.123
-0.49%
jan 1, 1969
24.803
-0.085
-0.34%
jan 1, 1970
24.754
-0.048
-0.19%
jan 1, 1971
24.744
-0.01
-0.04%
jan 1, 1972
24.773
+0.028
0.11%
jan 1, 1973
24.465
-0.307
-1.24%
jan 1, 1974
23.999
-0.467
-1.91%
jan 1, 1975
23.554
-0.445
-1.85%
jan 1, 1976
23.124
-0.429
-1.82%
jan 1, 1977
22.708
-0.416
-1.8%
jan 1, 1978
22.305
-0.403
-1.77%
jan 1, 1979
21.918
-0.387
-1.74%
jan 1, 1980
21.548
-0.37
-1.69%
jan 1, 1981
21.196
-0.351
-1.63%
jan 1, 1982
20.863
-0.333
-1.57%
jan 1, 1983
20.368
-0.495
-2.37%
jan 1, 1984
19.817
-0.551
-2.7%
jan 1, 1985
19.287
-0.53
-2.67%
jan 1, 1986
18.777
-0.51
-2.65%
jan 1, 1987
18.285
-0.492
-2.62%
jan 1, 1988
17.812
-0.473
-2.59%
jan 1, 1989
17.36
-0.452
-2.54%
jan 1, 1990
16.932
-0.428
-2.47%
jan 1, 1991
16.529
-0.403
-2.38%
jan 1, 1992
16.131
-0.397
-2.4%
jan 1, 1993
15.748
-0.383
-2.37%
jan 1, 1994
15.386
-0.362
-2.3%
jan 1, 1995
15.043
-0.344
-2.23%
jan 1, 1996
14.716
-0.327
-2.17%
jan 1, 1997
14.404
-0.311
-2.12%
jan 1, 1998
14.108
-0.296
-2.06%
jan 1, 1999
13.826
-0.282
-2.0%
jan 1, 2000
13.556
-0.27
-1.95%
jan 1, 2001
13.297
-0.259
-1.91%
jan 1, 2002
13.048
-0.248
-1.87%
jan 1, 2003
12.816
-0.233
-1.78%
jan 1, 2004
12.595
-0.221
-1.73%
jan 1, 2005
12.382
-0.213
-1.69%
jan 1, 2006
12.178
-0.204
-1.65%
jan 1, 2007
11.981
-0.196
-1.61%
jan 1, 2008
11.792
-0.189
-1.58%
jan 1, 2009
11.611
-0.181
-1.54%
jan 1, 2010
11.437
-0.174
-1.5%
jan 1, 2011
11.27
-0.167
-1.46%
jan 1, 2012
11.11
-0.16
-1.42%
jan 1, 2013
10.957
-0.153
-1.38%
jan 1, 2014
10.81
-0.147
-1.35%
jan 1, 2015
10.667
-0.143
-1.32%
jan 1, 2016
10.534
-0.133
-1.25%
Ranking of countries by current statistics by years


Comments: