29
/
en
AIzaSyAYiBZKx7MnpbEhh9jyipgxe19OcubqV5w
April 1, 2024
32975
Europe & Central Asia (IDA & IBRD countries)
TEC
false
2
1
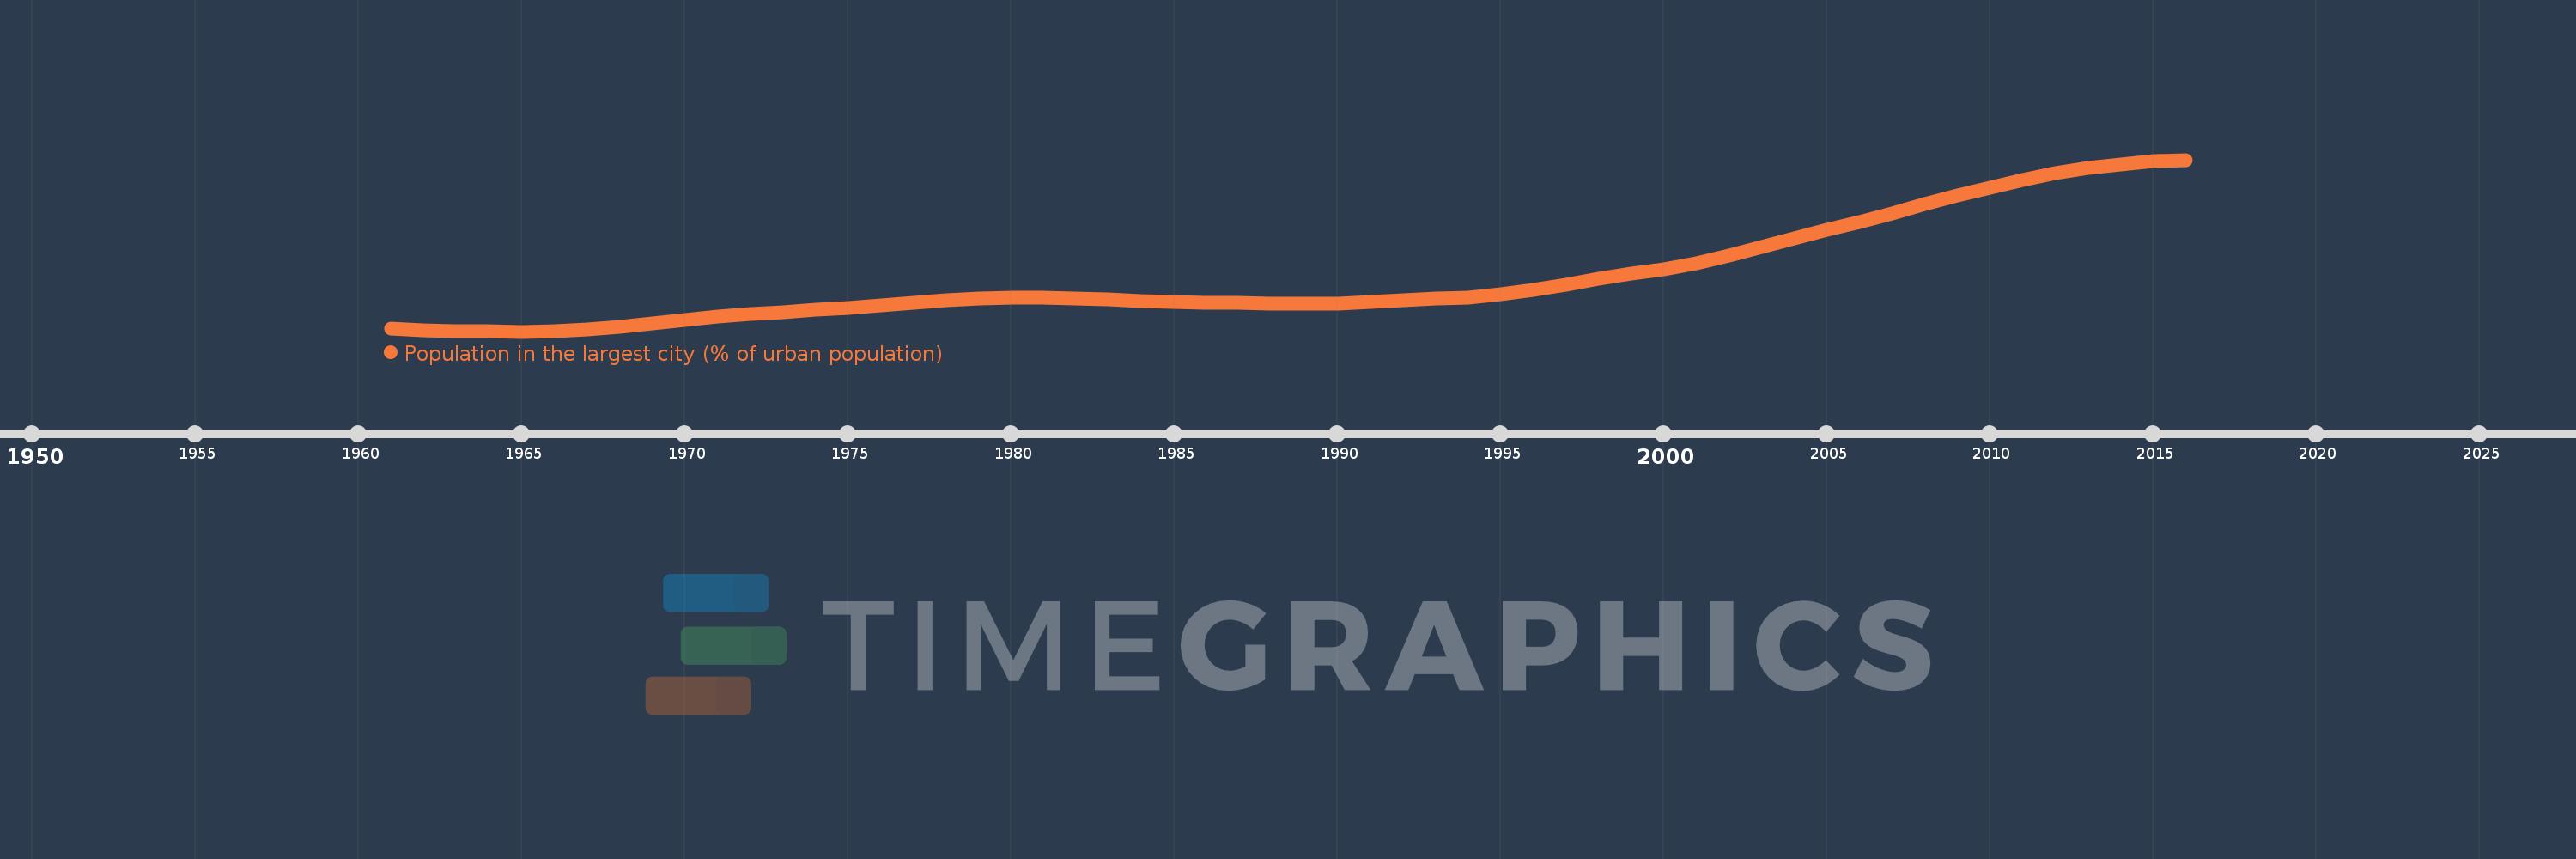
Population in the largest city (% of urban population)
2016,2015,2014,2013,2012,2011,2010,2009,2008,2007,2006,2005,2004,2003,2002,2001,2000,1999,1998,1997,1996,1995,1994,1993,1992,1991,1990,1989,1988,1987,1986,1985,1984,1983,1982,1981,1980,1979,1978,1977,1976,1975,1974,1973,1972,1971,1970,1969,1968,1967,1966,1965,1964,1963,1962,1961
This statistics in other country:
AfghanistanAlbaniaAlgeriaAngolaArab WorldArgentinaArmeniaAustraliaAustriaAzerbaijanBahrainBangladeshBelarusBelgiumBeninBoliviaBosnia and HerzegovinaBrazilBulgariaBurkina FasoBurundiCambodiaCameroonCanadaCentral African RepublicCentral Europe and the BalticsChadChileChinaColombiaCongo, Dem. Rep.Congo, Rep.Costa RicaCote d'IvoireCroatiaCubaCzech RepublicDenmarkDjiboutiDominican RepublicEarly-demographic dividendEast Asia & PacificEast Asia & Pacific (excluding high income)East Asia & Pacific (IDA & IBRD countries)EcuadorEgypt, Arab Rep.El SalvadorEritreaEstoniaEthiopiaEuro areaEurope & Central AsiaEurope & Central Asia (excluding high income)Europe & Central Asia (IDA & IBRD countries)European UnionFinlandFragile and conflict affected situationsFranceGabonGambia, TheGeorgiaGermanyGhanaGreeceGuatemalaGuineaGuinea-BissauHaitiHeavily indebted poor countries (HIPC)High incomeHondurasHong Kong SAR, ChinaHungaryIBRD onlyIDA & IBRD totalIDA blendIDA onlyIDA totalIndiaIndonesiaIran, Islamic Rep.IraqIrelandIsraelItalyJamaicaJapanJordanKazakhstanKenyaKorea, Dem. People’s Rep.Korea, Rep.KuwaitKyrgyz RepublicLao PDRLate-demographic dividendLatin America & Caribbean Latin America & Caribbean (excluding high income)Latin America & the Caribbean (IDA & IBRD countries)LatviaLeast developed countries: UN classificationLebanonLiberiaLibyaLithuaniaLow & middle incomeLow incomeLower middle incomeMacao SAR, ChinaMacedonia, FYRMadagascarMalawiMalaysiaMaliMauritaniaMexicoMiddle East & North AfricaMiddle East & North Africa (excluding high income)Middle East & North Africa (IDA & IBRD countries)Middle incomeMoldovaMongoliaMoroccoMozambiqueMyanmarNamibiaNepalNetherlandsNew ZealandNicaraguaNigerNigeriaNorth AmericaNorwayOECD membersOmanPakistanPanamaPapua New GuineaParaguayPeruPhilippinesPolandPortugalPost-demographic dividendPre-demographic dividendPuerto RicoQatarRomaniaRussian FederationRwandaSaudi ArabiaSenegalSerbiaSierra LeoneSingaporeSlovak RepublicSomaliaSouth AfricaSouth AsiaSouth Asia (IDA & IBRD)South SudanSpainSri LankaSub-Saharan Africa Sub-Saharan Africa (excluding high income)Sub-Saharan Africa (IDA & IBRD countries)SudanSwedenSwitzerlandSyrian Arab RepublicTajikistanTanzaniaThailandTogoTunisiaTurkeyTurkmenistanUgandaUkraineUnited Arab EmiratesUnited KingdomUnited StatesUpper middle incomeUruguayUzbekistanVenezuela, RBVietnamWest Bank and GazaWorldYemen, Rep.ZambiaZimbabwe Timeline:
This timeline shows a graph from 1961 to 2016 of Europe & Central Asia (IDA & IBRD countries). No data until 1960. Number of actual observations by date: 56.
Source name:
World Development Indicators
Source organization:
United Nations, World Urbanization Prospects.
Categories, topics:
Urban Development
Last updated:
apr 23, 2017
Indicators value changes by year
Minimum:
13.176
jan 1, 1965
Maximum:
17.365
jan 1, 2016
At the date of observation
Value
Absolute change
Change from previous value
jan 1, 1961
13.253
+13.253
0.0%
jan 1, 1962
13.215
-0.038
-0.29%
jan 1, 1963
13.194
-0.021
-0.16%
jan 1, 1964
13.18
-0.014
-0.11%
jan 1, 1965
13.176
-0.004
-0.03%
jan 1, 1966
13.185
+0.009
0.07%
jan 1, 1967
13.237
+0.052
0.4%
jan 1, 1968
13.3
+0.063
0.48%
jan 1, 1969
13.375
+0.075
0.56%
jan 1, 1970
13.463
+0.087
0.65%
jan 1, 1971
13.552
+0.09
0.67%
jan 1, 1972
13.61
+0.058
0.43%
jan 1, 1973
13.65
+0.04
0.29%
jan 1, 1974
13.7
+0.05
0.37%
jan 1, 1975
13.757
+0.057
0.42%
jan 1, 1976
13.825
+0.068
0.5%
jan 1, 1977
13.885
+0.059
0.43%
jan 1, 1978
13.934
+0.049
0.36%
jan 1, 1979
13.978
+0.044
0.31%
jan 1, 1980
14.004
+0.026
0.19%
jan 1, 1981
14.003
-0.001
-0.01%
jan 1, 1982
13.981
-0.022
-0.16%
jan 1, 1983
13.953
-0.027
-0.2%
jan 1, 1984
13.93
-0.023
-0.17%
jan 1, 1985
13.902
-0.029
-0.21%
jan 1, 1986
13.881
-0.021
-0.15%
jan 1, 1987
13.868
-0.013
-0.09%
jan 1, 1988
13.859
-0.009
-0.07%
jan 1, 1989
13.86
+0.001
0.01%
jan 1, 1990
13.864
+0.004
0.03%
jan 1, 1991
13.892
+0.028
0.2%
jan 1, 1992
13.943
+0.051
0.36%
jan 1, 1993
13.979
+0.037
0.26%
jan 1, 1994
14.013
+0.033
0.24%
jan 1, 1995
14.087
+0.074
0.53%
jan 1, 1996
14.186
+0.1
0.71%
jan 1, 1997
14.316
+0.129
0.91%
jan 1, 1998
14.457
+0.141
0.99%
jan 1, 1999
14.584
+0.127
0.88%
jan 1, 2000
14.704
+0.12
0.82%
jan 1, 2001
14.851
+0.147
1.0%
jan 1, 2002
15.03
+0.179
1.21%
jan 1, 2003
15.247
+0.216
1.44%
jan 1, 2004
15.451
+0.205
1.34%
jan 1, 2005
15.648
+0.197
1.28%
jan 1, 2006
15.854
+0.205
1.31%
jan 1, 2007
16.065
+0.211
1.33%
jan 1, 2008
16.281
+0.215
1.34%
jan 1, 2009
16.49
+0.209
1.29%
jan 1, 2010
16.685
+0.195
1.18%
jan 1, 2011
16.881
+0.196
1.18%
jan 1, 2012
17.046
+0.165
0.98%
jan 1, 2013
17.158
+0.111
0.65%
jan 1, 2014
17.243
+0.085
0.5%
jan 1, 2015
17.33
+0.087
0.51%
jan 1, 2016
17.365
+0.035
0.2%
Ranking of countries by current statistics by years


Comments: