29
/
en
AIzaSyAYiBZKx7MnpbEhh9jyipgxe19OcubqV5w
April 1, 2024
270869
Turkmenistan
TKM
true
2
1
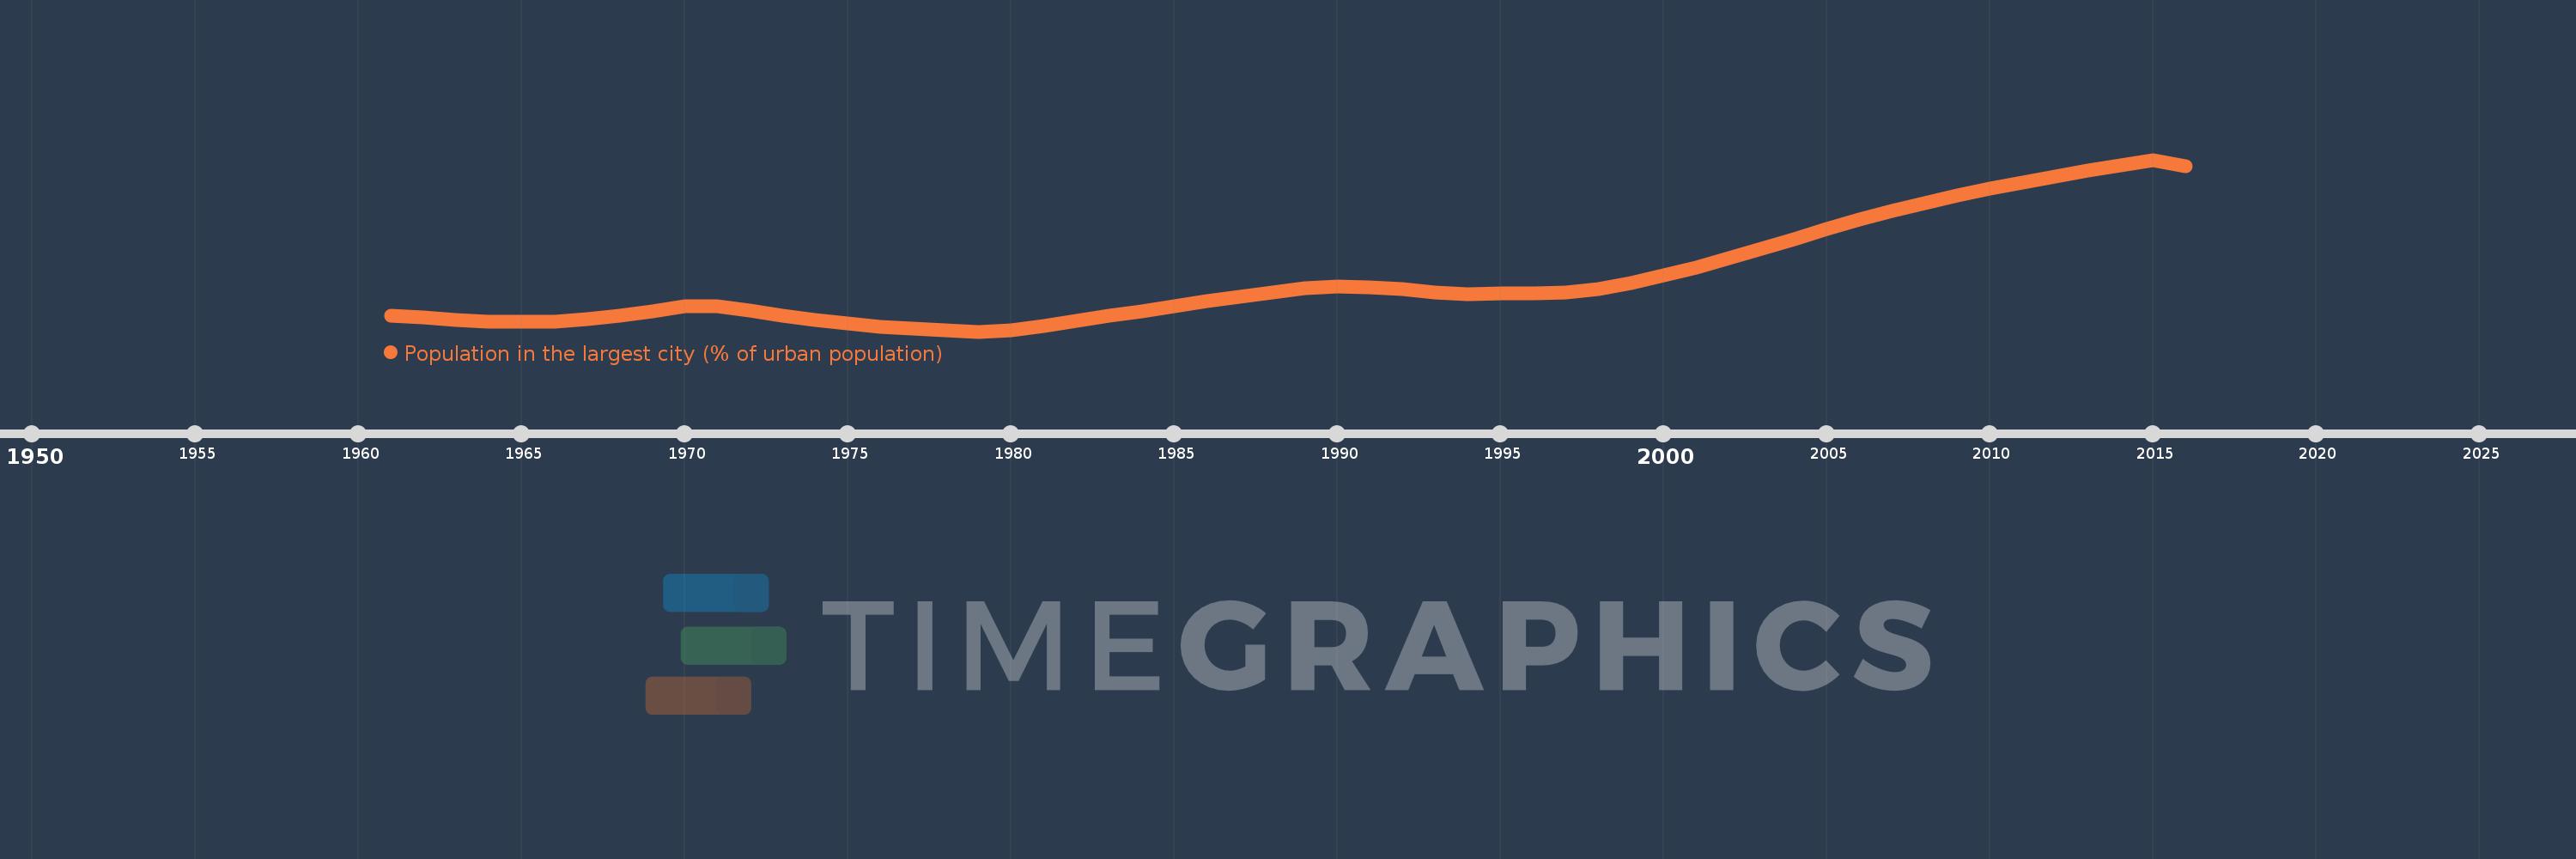
Population in the largest city (% of urban population)
2016,2015,2014,2013,2012,2011,2010,2009,2008,2007,2006,2005,2004,2003,2002,2001,2000,1999,1998,1997,1996,1995,1994,1993,1992,1991,1990,1989,1988,1987,1986,1985,1984,1983,1982,1981,1980,1979,1978,1977,1976,1975,1974,1973,1972,1971,1970,1969,1968,1967,1966,1965,1964,1963,1962,1961
This statistics in other country:
AfghanistanAlbaniaAlgeriaAngolaArab WorldArgentinaArmeniaAustraliaAustriaAzerbaijanBahrainBangladeshBelarusBelgiumBeninBoliviaBosnia and HerzegovinaBrazilBulgariaBurkina FasoBurundiCambodiaCameroonCanadaCentral African RepublicCentral Europe and the BalticsChadChileChinaColombiaCongo, Dem. Rep.Congo, Rep.Costa RicaCote d'IvoireCroatiaCubaCzech RepublicDenmarkDjiboutiDominican RepublicEarly-demographic dividendEast Asia & PacificEast Asia & Pacific (excluding high income)East Asia & Pacific (IDA & IBRD countries)EcuadorEgypt, Arab Rep.El SalvadorEritreaEstoniaEthiopiaEuro areaEurope & Central AsiaEurope & Central Asia (excluding high income)Europe & Central Asia (IDA & IBRD countries)European UnionFinlandFragile and conflict affected situationsFranceGabonGambia, TheGeorgiaGermanyGhanaGreeceGuatemalaGuineaGuinea-BissauHaitiHeavily indebted poor countries (HIPC)High incomeHondurasHong Kong SAR, ChinaHungaryIBRD onlyIDA & IBRD totalIDA blendIDA onlyIDA totalIndiaIndonesiaIran, Islamic Rep.IraqIrelandIsraelItalyJamaicaJapanJordanKazakhstanKenyaKorea, Dem. People’s Rep.Korea, Rep.KuwaitKyrgyz RepublicLao PDRLate-demographic dividendLatin America & Caribbean Latin America & Caribbean (excluding high income)Latin America & the Caribbean (IDA & IBRD countries)LatviaLeast developed countries: UN classificationLebanonLiberiaLibyaLithuaniaLow & middle incomeLow incomeLower middle incomeMacao SAR, ChinaMacedonia, FYRMadagascarMalawiMalaysiaMaliMauritaniaMexicoMiddle East & North AfricaMiddle East & North Africa (excluding high income)Middle East & North Africa (IDA & IBRD countries)Middle incomeMoldovaMongoliaMoroccoMozambiqueMyanmarNamibiaNepalNetherlandsNew ZealandNicaraguaNigerNigeriaNorth AmericaNorwayOECD membersOmanPakistanPanamaPapua New GuineaParaguayPeruPhilippinesPolandPortugalPost-demographic dividendPre-demographic dividendPuerto RicoQatarRomaniaRussian FederationRwandaSaudi ArabiaSenegalSerbiaSierra LeoneSingaporeSlovak RepublicSomaliaSouth AfricaSouth AsiaSouth Asia (IDA & IBRD)South SudanSpainSri LankaSub-Saharan Africa Sub-Saharan Africa (excluding high income)Sub-Saharan Africa (IDA & IBRD countries)SudanSwedenSwitzerlandSyrian Arab RepublicTajikistanTanzaniaThailandTogoTunisiaTurkeyTurkmenistanUgandaUkraineUnited Arab EmiratesUnited KingdomUnited StatesUpper middle incomeUruguayUzbekistanVenezuela, RBVietnamWest Bank and GazaWorldYemen, Rep.ZambiaZimbabwe Timeline:
This timeline shows a graph from 1961 to 2016 of Turkmenistan. No data until 1960. Number of actual observations by date: 56.
Source name:
World Development Indicators
Source organization:
United Nations, World Urbanization Prospects.
Categories, topics:
Urban Development
Last updated:
apr 23, 2017
Indicators value changes by year
Minimum:
23.857
jan 1, 1979
At the date of observation
Value
Absolute change
Change from previous value
jan 1, 1961
24.223
+24.223
0.0%
jan 1, 1962
24.18
-0.043
-0.18%
jan 1, 1963
24.133
-0.047
-0.19%
jan 1, 1964
24.094
-0.039
-0.16%
jan 1, 1965
24.079
-0.014
-0.06%
jan 1, 1966
24.094
+0.014
0.06%
jan 1, 1967
24.146
+0.052
0.22%
jan 1, 1968
24.228
+0.083
0.34%
jan 1, 1969
24.334
+0.106
0.44%
jan 1, 1970
24.444
+0.11
0.45%
jan 1, 1971
24.454
+0.01
0.04%
jan 1, 1972
24.344
-0.111
-0.45%
jan 1, 1973
24.234
-0.109
-0.45%
jan 1, 1974
24.131
-0.103
-0.43%
jan 1, 1975
24.042
-0.089
-0.37%
jan 1, 1976
23.972
-0.07
-0.29%
jan 1, 1977
23.921
-0.052
-0.22%
jan 1, 1978
23.882
-0.039
-0.16%
jan 1, 1979
23.857
-0.025
-0.1%
jan 1, 1980
23.892
+0.035
0.15%
jan 1, 1981
23.996
+0.104
0.43%
jan 1, 1982
24.106
+0.109
0.46%
jan 1, 1983
24.222
+0.117
0.48%
jan 1, 1984
24.34
+0.118
0.49%
jan 1, 1985
24.457
+0.116
0.48%
jan 1, 1986
24.565
+0.108
0.44%
jan 1, 1987
24.671
+0.106
0.43%
jan 1, 1988
24.778
+0.107
0.43%
jan 1, 1989
24.876
+0.098
0.4%
jan 1, 1990
24.917
+0.042
0.17%
jan 1, 1991
24.896
-0.021
-0.09%
jan 1, 1992
24.847
-0.049
-0.2%
jan 1, 1993
24.784
-0.062
-0.25%
jan 1, 1994
24.738
-0.047
-0.19%
jan 1, 1995
24.749
+0.011
0.05%
jan 1, 1996
24.762
+0.013
0.05%
jan 1, 1997
24.771
+0.009
0.04%
jan 1, 1998
24.854
+0.083
0.33%
jan 1, 1999
24.995
+0.141
0.57%
jan 1, 2000
25.171
+0.176
0.71%
jan 1, 2001
25.365
+0.194
0.77%
jan 1, 2002
25.574
+0.209
0.82%
jan 1, 2003
25.799
+0.224
0.88%
jan 1, 2004
26.032
+0.233
0.9%
jan 1, 2005
26.265
+0.233
0.9%
jan 1, 2006
26.485
+0.221
0.84%
jan 1, 2007
26.689
+0.204
0.77%
jan 1, 2008
26.877
+0.187
0.7%
jan 1, 2009
27.048
+0.172
0.64%
jan 1, 2010
27.208
+0.159
0.59%
jan 1, 2011
27.359
+0.151
0.55%
jan 1, 2012
27.5
+0.141
0.52%
jan 1, 2013
27.633
+0.133
0.48%
jan 1, 2014
27.762
+0.129
0.47%
jan 1, 2015
27.89
+0.129
0.46%
jan 1, 2016
27.744
-0.147
-0.53%
Ranking of countries by current statistics by years


Comments: