29
/
en
AIzaSyAYiBZKx7MnpbEhh9jyipgxe19OcubqV5w
April 1, 2024
230244
Russian Federation
RUS
true
2
1
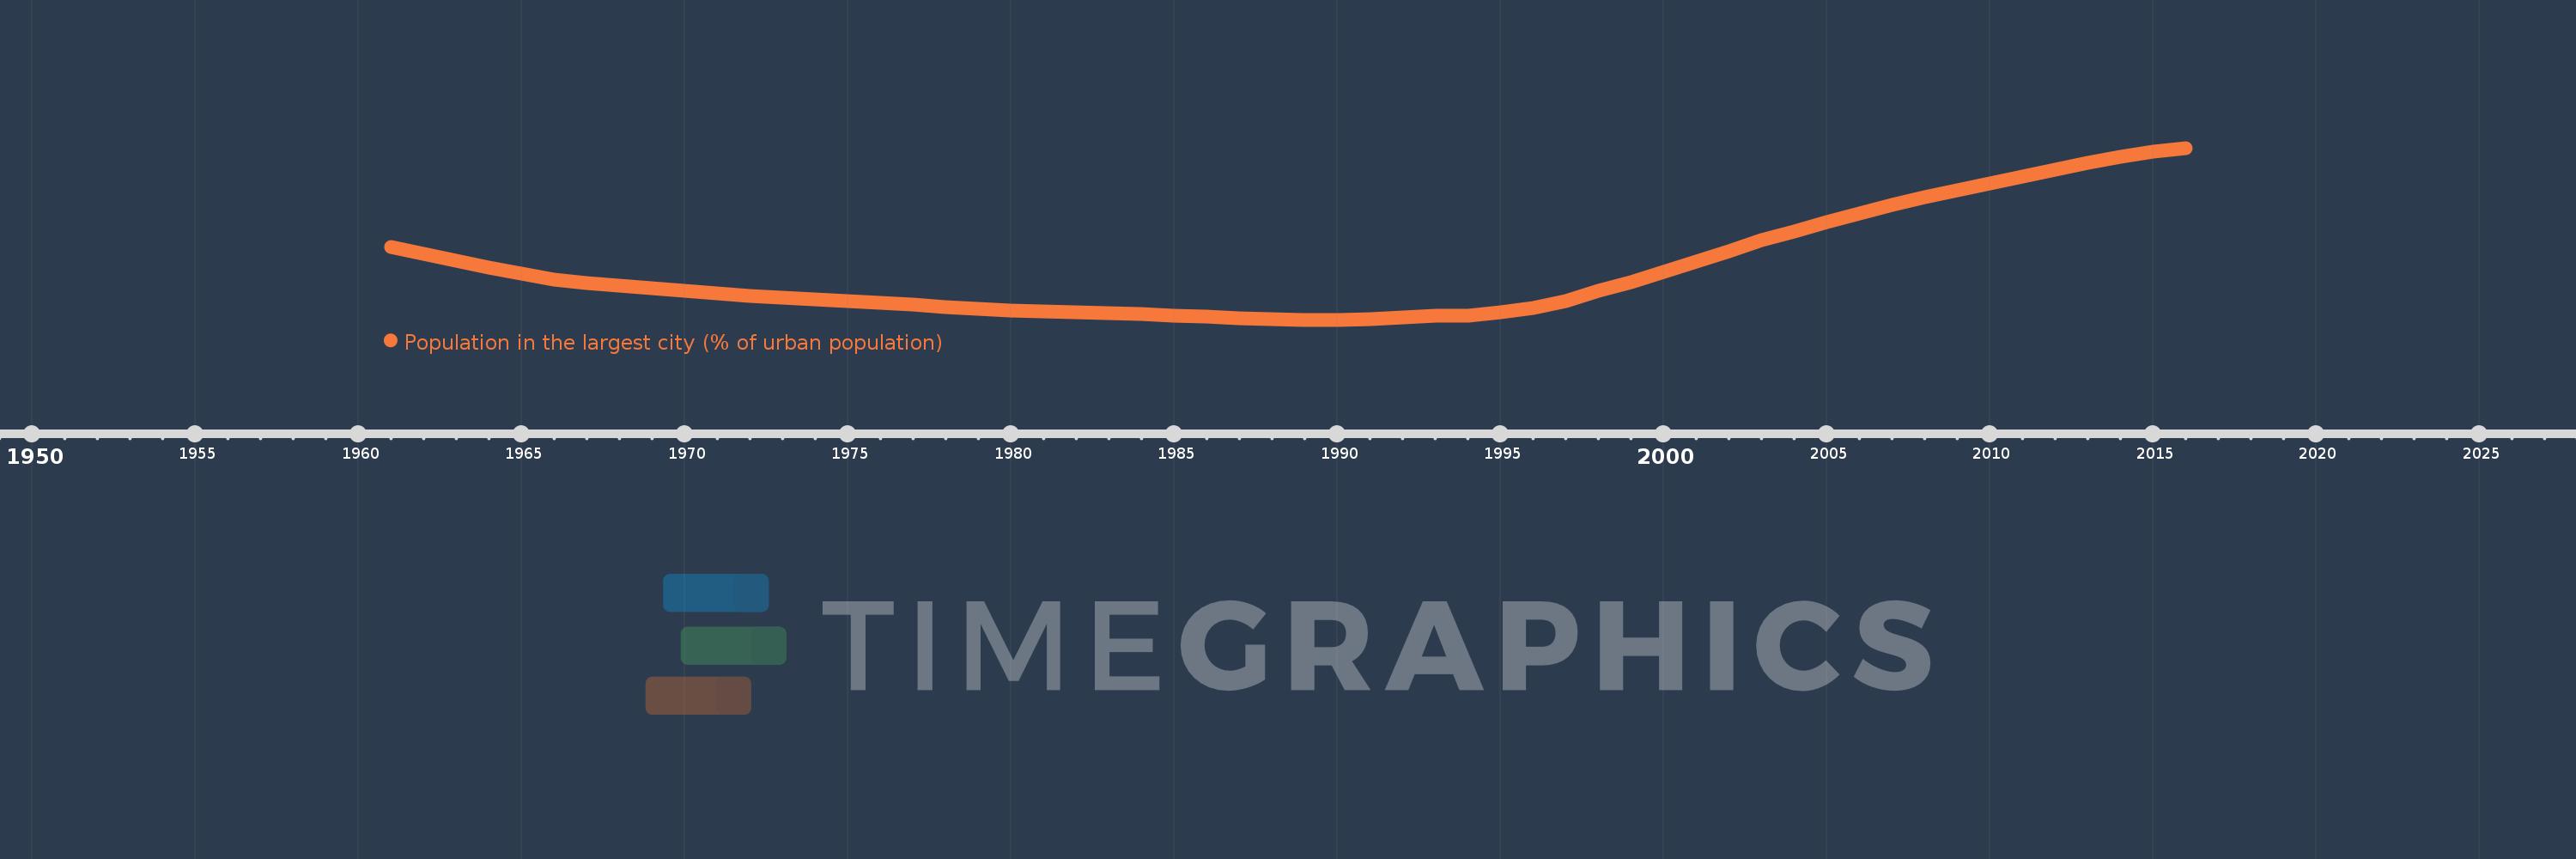
Population in the largest city (% of urban population)
2016,2015,2014,2013,2012,2011,2010,2009,2008,2007,2006,2005,2004,2003,2002,2001,2000,1999,1998,1997,1996,1995,1994,1993,1992,1991,1990,1989,1988,1987,1986,1985,1984,1983,1982,1981,1980,1979,1978,1977,1976,1975,1974,1973,1972,1971,1970,1969,1968,1967,1966,1965,1964,1963,1962,1961
This statistics in other country:
AfghanistanAlbaniaAlgeriaAngolaArab WorldArgentinaArmeniaAustraliaAustriaAzerbaijanBahrainBangladeshBelarusBelgiumBeninBoliviaBosnia and HerzegovinaBrazilBulgariaBurkina FasoBurundiCambodiaCameroonCanadaCentral African RepublicCentral Europe and the BalticsChadChileChinaColombiaCongo, Dem. Rep.Congo, Rep.Costa RicaCote d'IvoireCroatiaCubaCzech RepublicDenmarkDjiboutiDominican RepublicEarly-demographic dividendEast Asia & PacificEast Asia & Pacific (excluding high income)East Asia & Pacific (IDA & IBRD countries)EcuadorEgypt, Arab Rep.El SalvadorEritreaEstoniaEthiopiaEuro areaEurope & Central AsiaEurope & Central Asia (excluding high income)Europe & Central Asia (IDA & IBRD countries)European UnionFinlandFragile and conflict affected situationsFranceGabonGambia, TheGeorgiaGermanyGhanaGreeceGuatemalaGuineaGuinea-BissauHaitiHeavily indebted poor countries (HIPC)High incomeHondurasHong Kong SAR, ChinaHungaryIBRD onlyIDA & IBRD totalIDA blendIDA onlyIDA totalIndiaIndonesiaIran, Islamic Rep.IraqIrelandIsraelItalyJamaicaJapanJordanKazakhstanKenyaKorea, Dem. People’s Rep.Korea, Rep.KuwaitKyrgyz RepublicLao PDRLate-demographic dividendLatin America & Caribbean Latin America & Caribbean (excluding high income)Latin America & the Caribbean (IDA & IBRD countries)LatviaLeast developed countries: UN classificationLebanonLiberiaLibyaLithuaniaLow & middle incomeLow incomeLower middle incomeMacao SAR, ChinaMacedonia, FYRMadagascarMalawiMalaysiaMaliMauritaniaMexicoMiddle East & North AfricaMiddle East & North Africa (excluding high income)Middle East & North Africa (IDA & IBRD countries)Middle incomeMoldovaMongoliaMoroccoMozambiqueMyanmarNamibiaNepalNetherlandsNew ZealandNicaraguaNigerNigeriaNorth AmericaNorwayOECD membersOmanPakistanPanamaPapua New GuineaParaguayPeruPhilippinesPolandPortugalPost-demographic dividendPre-demographic dividendPuerto RicoQatarRomaniaRussian FederationRwandaSaudi ArabiaSenegalSerbiaSierra LeoneSingaporeSlovak RepublicSomaliaSouth AfricaSouth AsiaSouth Asia (IDA & IBRD)South SudanSpainSri LankaSub-Saharan Africa Sub-Saharan Africa (excluding high income)Sub-Saharan Africa (IDA & IBRD countries)SudanSwedenSwitzerlandSyrian Arab RepublicTajikistanTanzaniaThailandTogoTunisiaTurkeyTurkmenistanUgandaUkraineUnited Arab EmiratesUnited KingdomUnited StatesUpper middle incomeUruguayUzbekistanVenezuela, RBVietnamWest Bank and GazaWorldYemen, Rep.ZambiaZimbabwe Timeline:
This timeline shows a graph from 1961 to 2016 of Russian Federation. No data until 1960. Number of actual observations by date: 56.
Source name:
World Development Indicators
Source organization:
United Nations, World Urbanization Prospects.
Categories, topics:
Urban Development
Last updated:
apr 23, 2017
Indicators value changes by year
Maximum:
11.408
jan 1, 2016
At the date of observation
Value
Absolute change
Change from previous value
jan 1, 1961
9.577
+9.577
0.0%
jan 1, 1962
9.449
-0.128
-1.34%
jan 1, 1963
9.325
-0.124
-1.31%
jan 1, 1964
9.206
-0.119
-1.28%
jan 1, 1965
9.091
-0.115
-1.25%
jan 1, 1966
8.981
-0.11
-1.21%
jan 1, 1967
8.923
-0.058
-0.65%
jan 1, 1968
8.868
-0.055
-0.62%
jan 1, 1969
8.816
-0.052
-0.59%
jan 1, 1970
8.767
-0.049
-0.55%
jan 1, 1971
8.723
-0.044
-0.5%
jan 1, 1972
8.684
-0.04
-0.45%
jan 1, 1973
8.647
-0.037
-0.42%
jan 1, 1974
8.612
-0.035
-0.4%
jan 1, 1975
8.58
-0.032
-0.37%
jan 1, 1976
8.551
-0.03
-0.34%
jan 1, 1977
8.513
-0.038
-0.45%
jan 1, 1978
8.477
-0.036
-0.42%
jan 1, 1979
8.444
-0.033
-0.39%
jan 1, 1980
8.415
-0.028
-0.34%
jan 1, 1981
8.391
-0.024
-0.29%
jan 1, 1982
8.371
-0.02
-0.24%
jan 1, 1983
8.355
-0.016
-0.19%
jan 1, 1984
8.343
-0.013
-0.15%
jan 1, 1985
8.318
-0.025
-0.3%
jan 1, 1986
8.292
-0.026
-0.31%
jan 1, 1987
8.272
-0.02
-0.24%
jan 1, 1988
8.255
-0.018
-0.21%
jan 1, 1989
8.242
-0.013
-0.15%
jan 1, 1990
8.239
-0.003
-0.04%
jan 1, 1991
8.257
+0.018
0.22%
jan 1, 1992
8.288
+0.032
0.38%
jan 1, 1993
8.31
+0.022
0.26%
jan 1, 1994
8.319
+0.009
0.11%
jan 1, 1995
8.371
+0.051
0.62%
jan 1, 1996
8.452
+0.081
0.97%
jan 1, 1997
8.587
+0.136
1.6%
jan 1, 1998
8.766
+0.179
2.09%
jan 1, 1999
8.938
+0.172
1.96%
jan 1, 2000
9.114
+0.176
1.97%
jan 1, 2001
9.304
+0.19
2.08%
jan 1, 2002
9.498
+0.194
2.08%
jan 1, 2003
9.7
+0.202
2.12%
jan 1, 2004
9.874
+0.175
1.8%
jan 1, 2005
10.036
+0.161
1.63%
jan 1, 2006
10.197
+0.162
1.61%
jan 1, 2007
10.356
+0.159
1.56%
jan 1, 2008
10.501
+0.145
1.4%
jan 1, 2009
10.634
+0.133
1.27%
jan 1, 2010
10.761
+0.127
1.19%
jan 1, 2011
10.888
+0.127
1.18%
jan 1, 2012
11.013
+0.125
1.15%
jan 1, 2013
11.128
+0.115
1.04%
jan 1, 2014
11.237
+0.109
0.98%
jan 1, 2015
11.346
+0.109
0.97%
jan 1, 2016
11.408
+0.062
0.55%
Ranking of countries by current statistics by years


Comments: