29
/
en
AIzaSyAYiBZKx7MnpbEhh9jyipgxe19OcubqV5w
April 1, 2024
285092
Yemen, Rep.
YEM
true
2
1
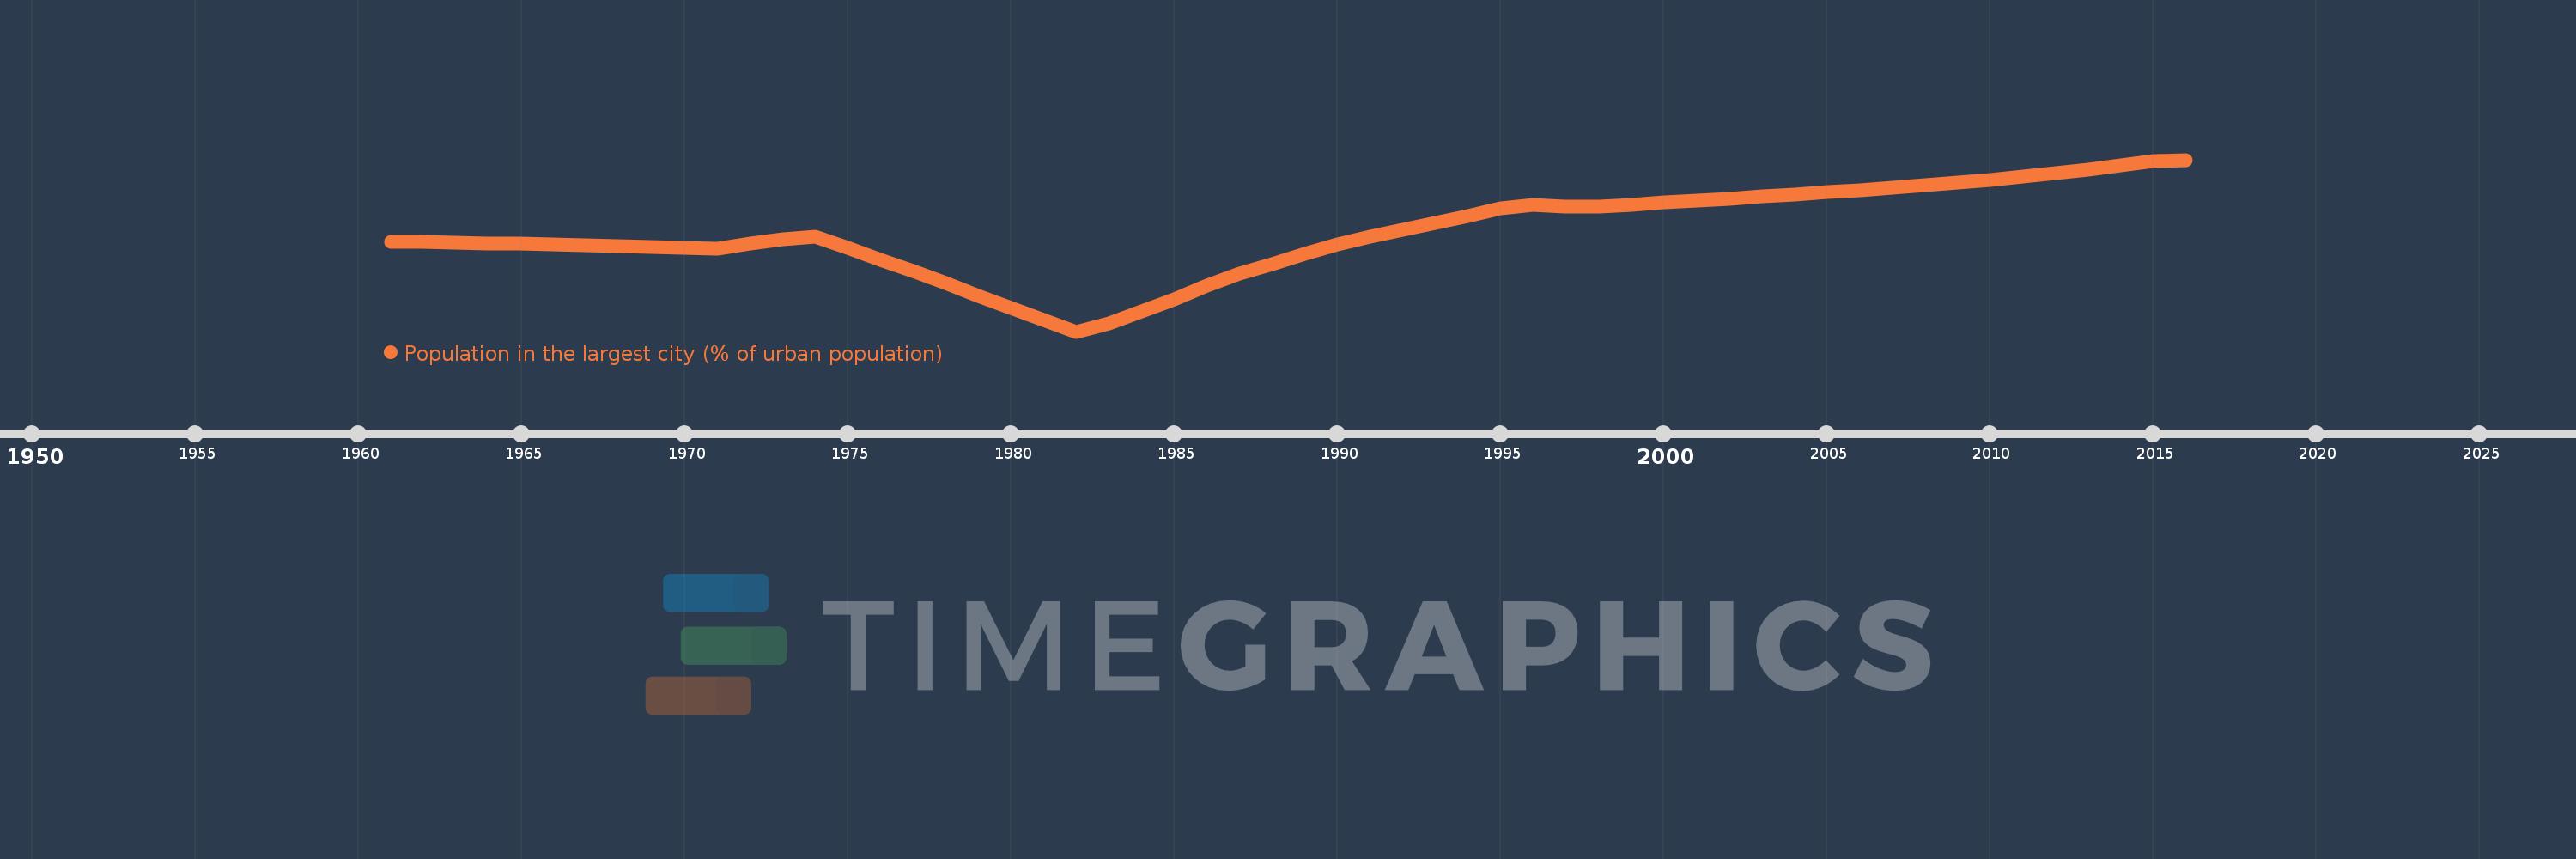
Population in the largest city (% of urban population)
2016,2015,2014,2013,2012,2011,2010,2009,2008,2007,2006,2005,2004,2003,2002,2001,2000,1999,1998,1997,1996,1995,1994,1993,1992,1991,1990,1989,1988,1987,1986,1985,1984,1983,1982,1981,1980,1979,1978,1977,1976,1975,1974,1973,1972,1971,1970,1969,1968,1967,1966,1965,1964,1963,1962,1961
This statistics in other country:
AfghanistanAlbaniaAlgeriaAngolaArab WorldArgentinaArmeniaAustraliaAustriaAzerbaijanBahrainBangladeshBelarusBelgiumBeninBoliviaBosnia and HerzegovinaBrazilBulgariaBurkina FasoBurundiCambodiaCameroonCanadaCentral African RepublicCentral Europe and the BalticsChadChileChinaColombiaCongo, Dem. Rep.Congo, Rep.Costa RicaCote d'IvoireCroatiaCubaCzech RepublicDenmarkDjiboutiDominican RepublicEarly-demographic dividendEast Asia & PacificEast Asia & Pacific (excluding high income)East Asia & Pacific (IDA & IBRD countries)EcuadorEgypt, Arab Rep.El SalvadorEritreaEstoniaEthiopiaEuro areaEurope & Central AsiaEurope & Central Asia (excluding high income)Europe & Central Asia (IDA & IBRD countries)European UnionFinlandFragile and conflict affected situationsFranceGabonGambia, TheGeorgiaGermanyGhanaGreeceGuatemalaGuineaGuinea-BissauHaitiHeavily indebted poor countries (HIPC)High incomeHondurasHong Kong SAR, ChinaHungaryIBRD onlyIDA & IBRD totalIDA blendIDA onlyIDA totalIndiaIndonesiaIran, Islamic Rep.IraqIrelandIsraelItalyJamaicaJapanJordanKazakhstanKenyaKorea, Dem. People’s Rep.Korea, Rep.KuwaitKyrgyz RepublicLao PDRLate-demographic dividendLatin America & Caribbean Latin America & Caribbean (excluding high income)Latin America & the Caribbean (IDA & IBRD countries)LatviaLeast developed countries: UN classificationLebanonLiberiaLibyaLithuaniaLow & middle incomeLow incomeLower middle incomeMacao SAR, ChinaMacedonia, FYRMadagascarMalawiMalaysiaMaliMauritaniaMexicoMiddle East & North AfricaMiddle East & North Africa (excluding high income)Middle East & North Africa (IDA & IBRD countries)Middle incomeMoldovaMongoliaMoroccoMozambiqueMyanmarNamibiaNepalNetherlandsNew ZealandNicaraguaNigerNigeriaNorth AmericaNorwayOECD membersOmanPakistanPanamaPapua New GuineaParaguayPeruPhilippinesPolandPortugalPost-demographic dividendPre-demographic dividendPuerto RicoQatarRomaniaRussian FederationRwandaSaudi ArabiaSenegalSerbiaSierra LeoneSingaporeSlovak RepublicSomaliaSouth AfricaSouth AsiaSouth Asia (IDA & IBRD)South SudanSpainSri LankaSub-Saharan Africa Sub-Saharan Africa (excluding high income)Sub-Saharan Africa (IDA & IBRD countries)SudanSwedenSwitzerlandSyrian Arab RepublicTajikistanTanzaniaThailandTogoTunisiaTurkeyTurkmenistanUgandaUkraineUnited Arab EmiratesUnited KingdomUnited StatesUpper middle incomeUruguayUzbekistanVenezuela, RBVietnamWest Bank and GazaWorldYemen, Rep.ZambiaZimbabwe Timeline:
This timeline shows a graph from 1961 to 2016 of Yemen, Rep.. No data until 1960. Number of actual observations by date: 56.
Source name:
World Development Indicators
Source organization:
United Nations, World Urbanization Prospects.
Categories, topics:
Urban Development
Last updated:
apr 23, 2017
Indicators value changes by year
Minimum:
18.932
jan 1, 1982
Maximum:
31.898
jan 1, 2016
At the date of observation
Value
Absolute change
Change from previous value
jan 1, 1961
25.737
+25.737
0.0%
jan 1, 1962
25.691
-0.046
-0.18%
jan 1, 1963
25.646
-0.045
-0.18%
jan 1, 1964
25.599
-0.047
-0.18%
jan 1, 1965
25.553
-0.046
-0.18%
jan 1, 1966
25.499
-0.054
-0.21%
jan 1, 1967
25.439
-0.06
-0.23%
jan 1, 1968
25.367
-0.072
-0.28%
jan 1, 1969
25.294
-0.073
-0.29%
jan 1, 1970
25.236
-0.058
-0.23%
jan 1, 1971
25.194
-0.042
-0.17%
jan 1, 1972
25.55
+0.355
1.41%
jan 1, 1973
25.919
+0.369
1.44%
jan 1, 1974
26.113
+0.194
0.75%
jan 1, 1975
25.269
-0.844
-3.23%
jan 1, 1976
24.36
-0.909
-3.6%
jan 1, 1977
23.483
-0.876
-3.6%
jan 1, 1978
22.563
-0.92
-3.92%
jan 1, 1979
21.624
-0.939
-4.16%
jan 1, 1980
20.698
-0.926
-4.28%
jan 1, 1981
19.799
-0.898
-4.34%
jan 1, 1982
18.932
-0.867
-4.38%
jan 1, 1983
19.54
+0.608
3.21%
jan 1, 1984
20.441
+0.901
4.61%
jan 1, 1985
21.388
+0.947
4.63%
jan 1, 1986
22.377
+0.989
4.62%
jan 1, 1987
23.289
+0.912
4.07%
jan 1, 1988
24.036
+0.747
3.21%
jan 1, 1989
24.786
+0.75
3.12%
jan 1, 1990
25.48
+0.694
2.8%
jan 1, 1991
26.101
+0.621
2.44%
jan 1, 1992
26.632
+0.531
2.03%
jan 1, 1993
27.116
+0.483
1.82%
jan 1, 1994
27.622
+0.506
1.86%
jan 1, 1995
28.252
+0.631
2.28%
jan 1, 1996
28.474
+0.222
0.79%
jan 1, 1997
28.369
-0.106
-0.37%
jan 1, 1998
28.394
+0.025
0.09%
jan 1, 1999
28.512
+0.118
0.42%
jan 1, 2000
28.667
+0.155
0.54%
jan 1, 2001
28.824
+0.157
0.55%
jan 1, 2002
28.973
+0.149
0.52%
jan 1, 2003
29.127
+0.154
0.53%
jan 1, 2004
29.285
+0.158
0.54%
jan 1, 2005
29.45
+0.165
0.56%
jan 1, 2006
29.618
+0.168
0.57%
jan 1, 2007
29.792
+0.174
0.59%
jan 1, 2008
29.973
+0.181
0.61%
jan 1, 2009
30.164
+0.191
0.64%
jan 1, 2010
30.374
+0.21
0.7%
jan 1, 2011
30.607
+0.233
0.77%
jan 1, 2012
30.864
+0.258
0.84%
jan 1, 2013
31.148
+0.283
0.92%
jan 1, 2014
31.458
+0.31
0.99%
jan 1, 2015
31.8
+0.342
1.09%
jan 1, 2016
31.898
+0.099
0.31%
Ranking of countries by current statistics by years


Comments: