29
/
en
AIzaSyAYiBZKx7MnpbEhh9jyipgxe19OcubqV5w
April 1, 2024
52166
North America
NAC
false
2
1
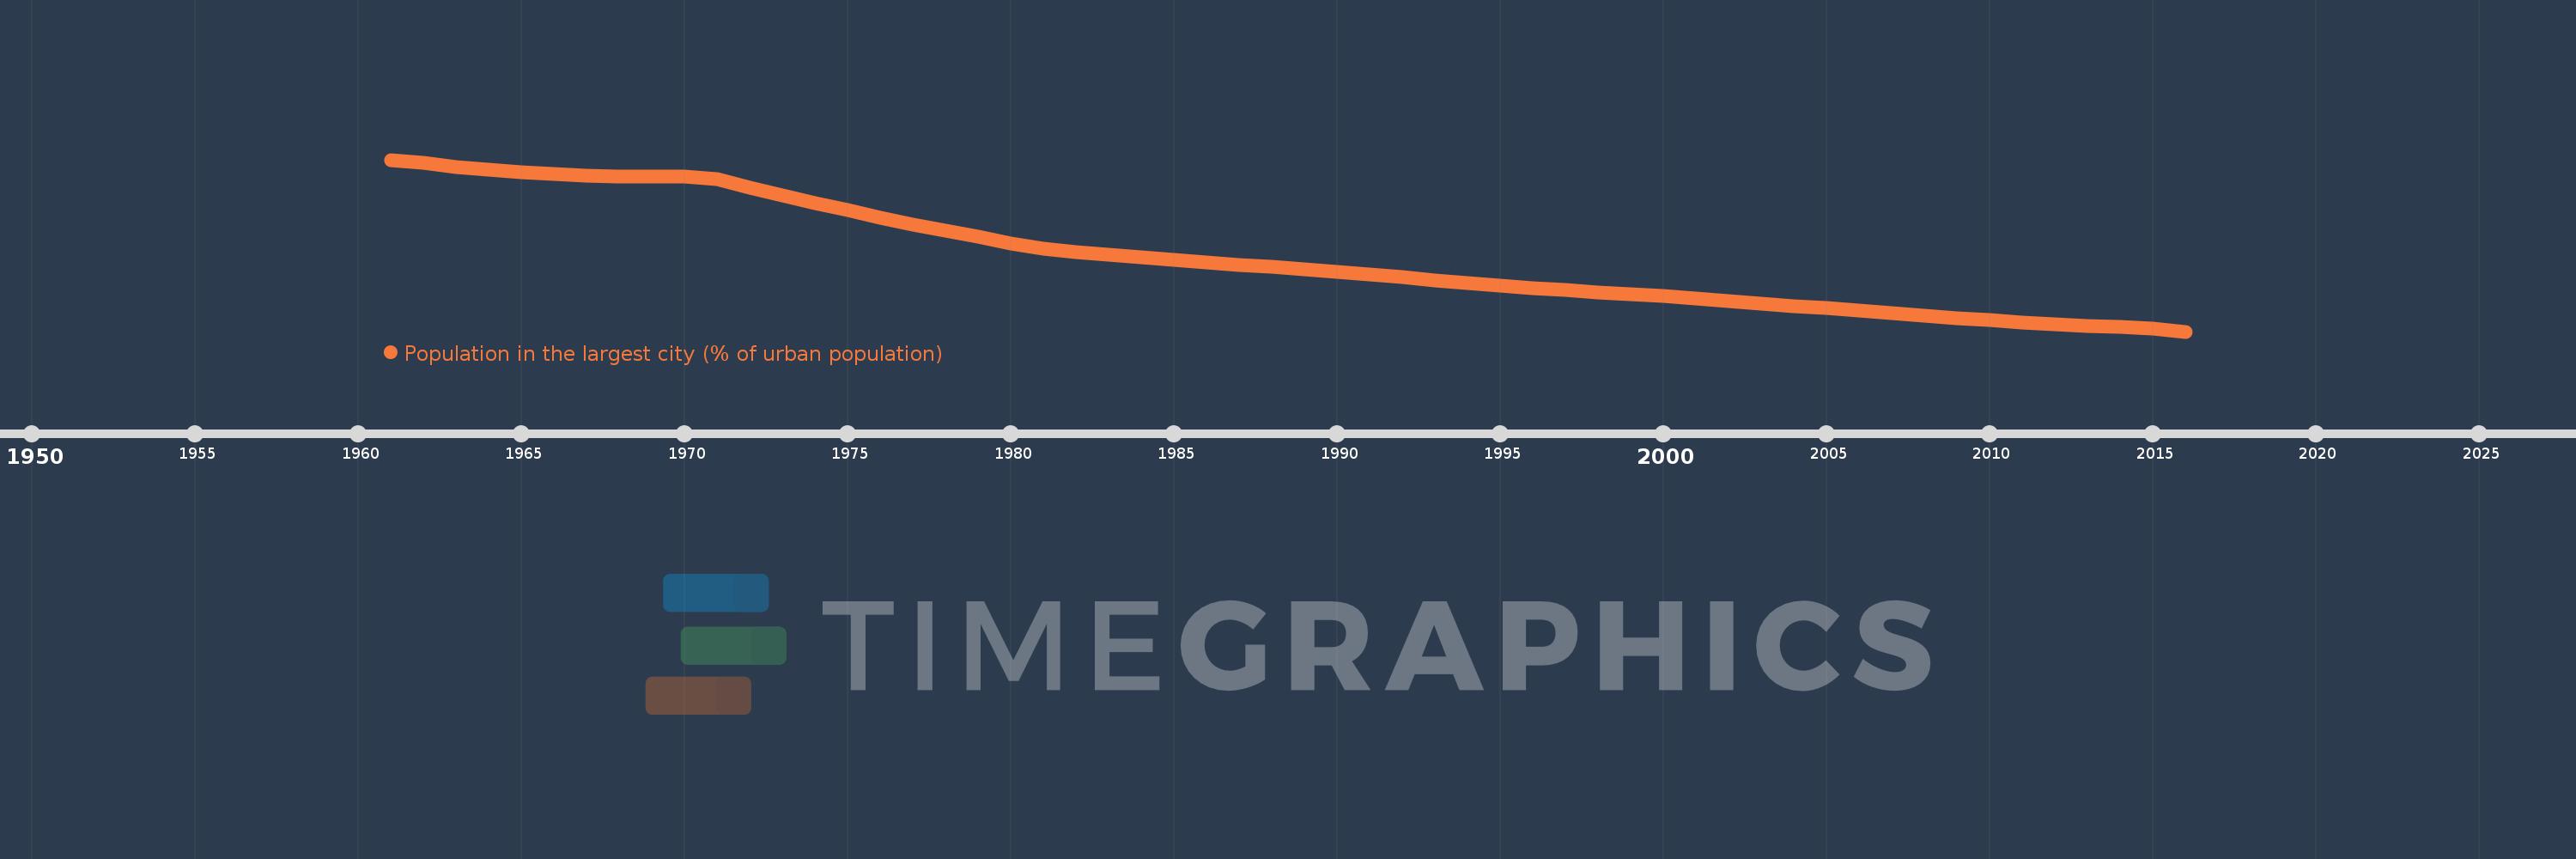
Population in the largest city (% of urban population)
2016,2015,2014,2013,2012,2011,2010,2009,2008,2007,2006,2005,2004,2003,2002,2001,2000,1999,1998,1997,1996,1995,1994,1993,1992,1991,1990,1989,1988,1987,1986,1985,1984,1983,1982,1981,1980,1979,1978,1977,1976,1975,1974,1973,1972,1971,1970,1969,1968,1967,1966,1965,1964,1963,1962,1961
This statistics in other country:
AfghanistanAlbaniaAlgeriaAngolaArab WorldArgentinaArmeniaAustraliaAustriaAzerbaijanBahrainBangladeshBelarusBelgiumBeninBoliviaBosnia and HerzegovinaBrazilBulgariaBurkina FasoBurundiCambodiaCameroonCanadaCentral African RepublicCentral Europe and the BalticsChadChileChinaColombiaCongo, Dem. Rep.Congo, Rep.Costa RicaCote d'IvoireCroatiaCubaCzech RepublicDenmarkDjiboutiDominican RepublicEarly-demographic dividendEast Asia & PacificEast Asia & Pacific (excluding high income)East Asia & Pacific (IDA & IBRD countries)EcuadorEgypt, Arab Rep.El SalvadorEritreaEstoniaEthiopiaEuro areaEurope & Central AsiaEurope & Central Asia (excluding high income)Europe & Central Asia (IDA & IBRD countries)European UnionFinlandFragile and conflict affected situationsFranceGabonGambia, TheGeorgiaGermanyGhanaGreeceGuatemalaGuineaGuinea-BissauHaitiHeavily indebted poor countries (HIPC)High incomeHondurasHong Kong SAR, ChinaHungaryIBRD onlyIDA & IBRD totalIDA blendIDA onlyIDA totalIndiaIndonesiaIran, Islamic Rep.IraqIrelandIsraelItalyJamaicaJapanJordanKazakhstanKenyaKorea, Dem. People’s Rep.Korea, Rep.KuwaitKyrgyz RepublicLao PDRLate-demographic dividendLatin America & Caribbean Latin America & Caribbean (excluding high income)Latin America & the Caribbean (IDA & IBRD countries)LatviaLeast developed countries: UN classificationLebanonLiberiaLibyaLithuaniaLow & middle incomeLow incomeLower middle incomeMacao SAR, ChinaMacedonia, FYRMadagascarMalawiMalaysiaMaliMauritaniaMexicoMiddle East & North AfricaMiddle East & North Africa (excluding high income)Middle East & North Africa (IDA & IBRD countries)Middle incomeMoldovaMongoliaMoroccoMozambiqueMyanmarNamibiaNepalNetherlandsNew ZealandNicaraguaNigerNigeriaNorth AmericaNorwayOECD membersOmanPakistanPanamaPapua New GuineaParaguayPeruPhilippinesPolandPortugalPost-demographic dividendPre-demographic dividendPuerto RicoQatarRomaniaRussian FederationRwandaSaudi ArabiaSenegalSerbiaSierra LeoneSingaporeSlovak RepublicSomaliaSouth AfricaSouth AsiaSouth Asia (IDA & IBRD)South SudanSpainSri LankaSub-Saharan Africa Sub-Saharan Africa (excluding high income)Sub-Saharan Africa (IDA & IBRD countries)SudanSwedenSwitzerlandSyrian Arab RepublicTajikistanTanzaniaThailandTogoTunisiaTurkeyTurkmenistanUgandaUkraineUnited Arab EmiratesUnited KingdomUnited StatesUpper middle incomeUruguayUzbekistanVenezuela, RBVietnamWest Bank and GazaWorldYemen, Rep.ZambiaZimbabwe Timeline:
This timeline shows a graph from 1961 to 2016 of North America. No data until 1960. Number of actual observations by date: 56.
Source name:
World Development Indicators
Source organization:
United Nations, World Urbanization Prospects.
Categories, topics:
Urban Development
Last updated:
apr 23, 2017
Indicators value changes by year
Maximum:
11.665
jan 1, 1961
At the date of observation
Value
Absolute change
Change from previous value
jan 1, 1961
11.665
+11.665
0.0%
jan 1, 1962
11.602
-0.063
-0.54%
jan 1, 1963
11.534
-0.068
-0.58%
jan 1, 1964
11.478
-0.056
-0.48%
jan 1, 1965
11.429
-0.049
-0.43%
jan 1, 1966
11.396
-0.033
-0.29%
jan 1, 1967
11.373
-0.023
-0.2%
jan 1, 1968
11.355
-0.018
-0.16%
jan 1, 1969
11.349
-0.006
-0.05%
jan 1, 1970
11.349
0.0
0.0%
jan 1, 1971
11.299
-0.05
-0.44%
jan 1, 1972
11.145
-0.154
-1.36%
jan 1, 1973
10.992
-0.154
-1.38%
jan 1, 1974
10.851
-0.141
-1.28%
jan 1, 1975
10.714
-0.136
-1.26%
jan 1, 1976
10.572
-0.142
-1.33%
jan 1, 1977
10.442
-0.129
-1.22%
jan 1, 1978
10.327
-0.115
-1.1%
jan 1, 1979
10.211
-0.116
-1.12%
jan 1, 1980
10.093
-0.118
-1.16%
jan 1, 1981
9.997
-0.097
-0.96%
jan 1, 1982
9.93
-0.067
-0.67%
jan 1, 1983
9.873
-0.056
-0.57%
jan 1, 1984
9.824
-0.05
-0.5%
jan 1, 1985
9.78
-0.044
-0.45%
jan 1, 1986
9.735
-0.045
-0.46%
jan 1, 1987
9.687
-0.047
-0.49%
jan 1, 1988
9.647
-0.041
-0.42%
jan 1, 1989
9.606
-0.041
-0.42%
jan 1, 1990
9.559
-0.047
-0.49%
jan 1, 1991
9.507
-0.052
-0.55%
jan 1, 1992
9.459
-0.047
-0.5%
jan 1, 1993
9.395
-0.065
-0.68%
jan 1, 1994
9.338
-0.057
-0.6%
jan 1, 1995
9.292
-0.046
-0.5%
jan 1, 1996
9.251
-0.041
-0.44%
jan 1, 1997
9.211
-0.04
-0.43%
jan 1, 1998
9.168
-0.043
-0.46%
jan 1, 1999
9.131
-0.037
-0.4%
jan 1, 2000
9.097
-0.034
-0.37%
jan 1, 2001
9.058
-0.039
-0.43%
jan 1, 2002
9.003
-0.055
-0.61%
jan 1, 2003
8.956
-0.047
-0.52%
jan 1, 2004
8.914
-0.042
-0.47%
jan 1, 2005
8.868
-0.046
-0.52%
jan 1, 2006
8.822
-0.045
-0.51%
jan 1, 2007
8.776
-0.046
-0.53%
jan 1, 2008
8.729
-0.047
-0.54%
jan 1, 2009
8.682
-0.047
-0.54%
jan 1, 2010
8.64
-0.041
-0.48%
jan 1, 2011
8.603
-0.037
-0.43%
jan 1, 2012
8.573
-0.03
-0.35%
jan 1, 2013
8.542
-0.031
-0.36%
jan 1, 2014
8.513
-0.029
-0.34%
jan 1, 2015
8.482
-0.031
-0.37%
jan 1, 2016
8.429
-0.052
-0.62%
Ranking of countries by current statistics by years


Comments: