29
/
en
AIzaSyAYiBZKx7MnpbEhh9jyipgxe19OcubqV5w
April 1, 2024
166656
Kazakhstan
KAZ
true
2
1
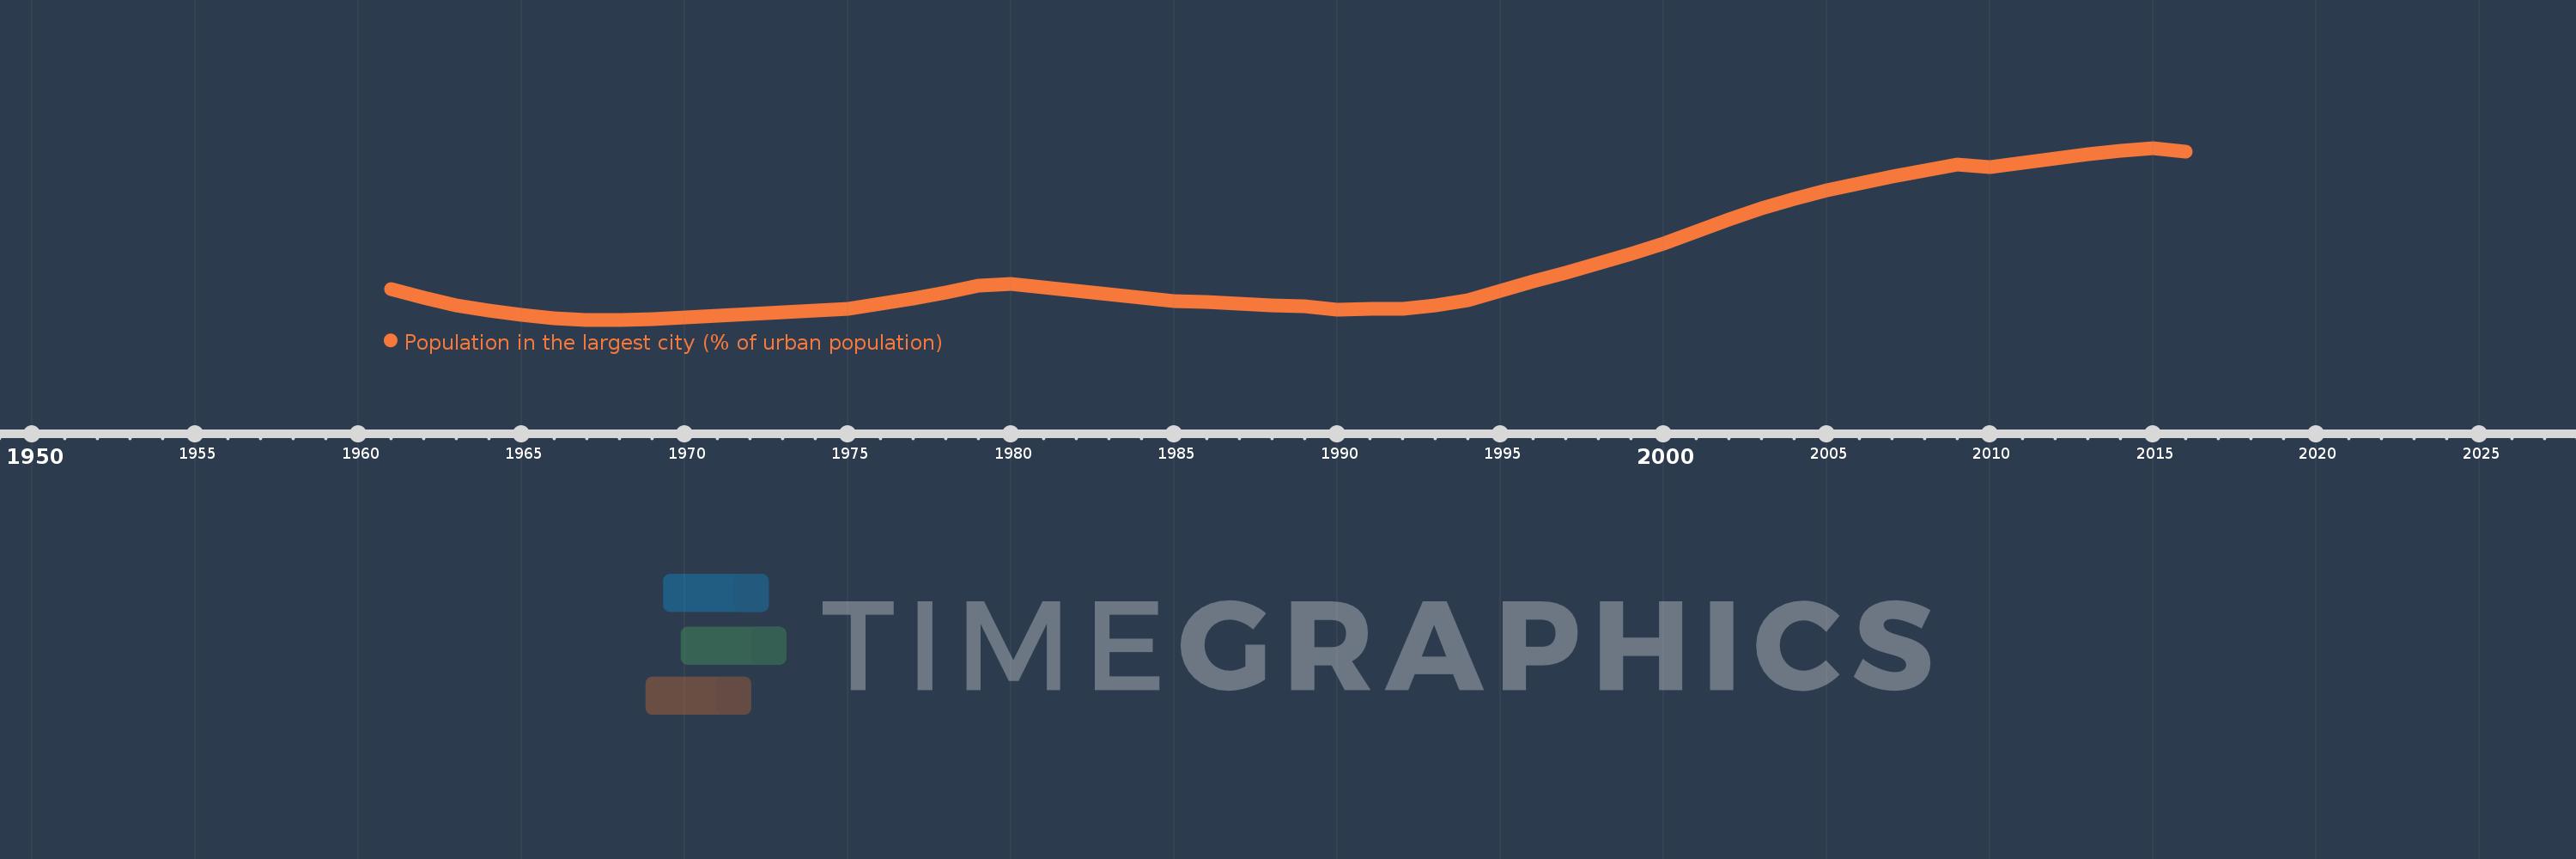
Population in the largest city (% of urban population)
2016,2015,2014,2013,2012,2011,2010,2009,2008,2007,2006,2005,2004,2003,2002,2001,2000,1999,1998,1997,1996,1995,1994,1993,1992,1991,1990,1989,1988,1987,1986,1985,1984,1983,1982,1981,1980,1979,1978,1977,1976,1975,1974,1973,1972,1971,1970,1969,1968,1967,1966,1965,1964,1963,1962,1961
This statistics in other country:
AfghanistanAlbaniaAlgeriaAngolaArab WorldArgentinaArmeniaAustraliaAustriaAzerbaijanBahrainBangladeshBelarusBelgiumBeninBoliviaBosnia and HerzegovinaBrazilBulgariaBurkina FasoBurundiCambodiaCameroonCanadaCentral African RepublicCentral Europe and the BalticsChadChileChinaColombiaCongo, Dem. Rep.Congo, Rep.Costa RicaCote d'IvoireCroatiaCubaCzech RepublicDenmarkDjiboutiDominican RepublicEarly-demographic dividendEast Asia & PacificEast Asia & Pacific (excluding high income)East Asia & Pacific (IDA & IBRD countries)EcuadorEgypt, Arab Rep.El SalvadorEritreaEstoniaEthiopiaEuro areaEurope & Central AsiaEurope & Central Asia (excluding high income)Europe & Central Asia (IDA & IBRD countries)European UnionFinlandFragile and conflict affected situationsFranceGabonGambia, TheGeorgiaGermanyGhanaGreeceGuatemalaGuineaGuinea-BissauHaitiHeavily indebted poor countries (HIPC)High incomeHondurasHong Kong SAR, ChinaHungaryIBRD onlyIDA & IBRD totalIDA blendIDA onlyIDA totalIndiaIndonesiaIran, Islamic Rep.IraqIrelandIsraelItalyJamaicaJapanJordanKazakhstanKenyaKorea, Dem. People’s Rep.Korea, Rep.KuwaitKyrgyz RepublicLao PDRLate-demographic dividendLatin America & Caribbean Latin America & Caribbean (excluding high income)Latin America & the Caribbean (IDA & IBRD countries)LatviaLeast developed countries: UN classificationLebanonLiberiaLibyaLithuaniaLow & middle incomeLow incomeLower middle incomeMacao SAR, ChinaMacedonia, FYRMadagascarMalawiMalaysiaMaliMauritaniaMexicoMiddle East & North AfricaMiddle East & North Africa (excluding high income)Middle East & North Africa (IDA & IBRD countries)Middle incomeMoldovaMongoliaMoroccoMozambiqueMyanmarNamibiaNepalNetherlandsNew ZealandNicaraguaNigerNigeriaNorth AmericaNorwayOECD membersOmanPakistanPanamaPapua New GuineaParaguayPeruPhilippinesPolandPortugalPost-demographic dividendPre-demographic dividendPuerto RicoQatarRomaniaRussian FederationRwandaSaudi ArabiaSenegalSerbiaSierra LeoneSingaporeSlovak RepublicSomaliaSouth AfricaSouth AsiaSouth Asia (IDA & IBRD)South SudanSpainSri LankaSub-Saharan Africa Sub-Saharan Africa (excluding high income)Sub-Saharan Africa (IDA & IBRD countries)SudanSwedenSwitzerlandSyrian Arab RepublicTajikistanTanzaniaThailandTogoTunisiaTurkeyTurkmenistanUgandaUkraineUnited Arab EmiratesUnited KingdomUnited StatesUpper middle incomeUruguayUzbekistanVenezuela, RBVietnamWest Bank and GazaWorldYemen, Rep.ZambiaZimbabwe Timeline:
This timeline shows a graph from 1961 to 2016 of Kazakhstan. No data until 1960. Number of actual observations by date: 56.
Source name:
World Development Indicators
Source organization:
United Nations, World Urbanization Prospects.
Categories, topics:
Urban Development
Last updated:
apr 23, 2017
Indicators value changes by year
Minimum:
11.431
jan 1, 1968
Maximum:
16.394
jan 1, 2015
At the date of observation
Value
Absolute change
Change from previous value
jan 1, 1961
12.313
+12.313
0.0%
jan 1, 1962
12.064
-0.249
-2.02%
jan 1, 1963
11.856
-0.207
-1.72%
jan 1, 1964
11.693
-0.163
-1.38%
jan 1, 1965
11.577
-0.117
-1.0%
jan 1, 1966
11.482
-0.095
-0.82%
jan 1, 1967
11.435
-0.047
-0.41%
jan 1, 1968
11.431
-0.004
-0.04%
jan 1, 1969
11.459
+0.028
0.24%
jan 1, 1970
11.503
+0.044
0.38%
jan 1, 1971
11.548
+0.045
0.39%
jan 1, 1972
11.589
+0.041
0.35%
jan 1, 1973
11.635
+0.046
0.39%
jan 1, 1974
11.687
+0.052
0.45%
jan 1, 1975
11.754
+0.067
0.57%
jan 1, 1976
11.894
+0.14
1.19%
jan 1, 1977
12.053
+0.159
1.34%
jan 1, 1978
12.226
+0.173
1.44%
jan 1, 1979
12.409
+0.183
1.5%
jan 1, 1980
12.47
+0.061
0.49%
jan 1, 1981
12.375
-0.095
-0.76%
jan 1, 1982
12.276
-0.099
-0.8%
jan 1, 1983
12.176
-0.1
-0.81%
jan 1, 1984
12.074
-0.102
-0.83%
jan 1, 1985
11.97
-0.104
-0.86%
jan 1, 1986
11.935
-0.035
-0.29%
jan 1, 1987
11.895
-0.04
-0.34%
jan 1, 1988
11.855
-0.04
-0.34%
jan 1, 1989
11.832
-0.023
-0.19%
jan 1, 1990
11.733
-0.099
-0.83%
jan 1, 1991
11.742
+0.009
0.08%
jan 1, 1992
11.749
+0.007
0.06%
jan 1, 1993
11.838
+0.089
0.76%
jan 1, 1994
11.998
+0.16
1.35%
jan 1, 1995
12.257
+0.259
2.16%
jan 1, 1996
12.535
+0.277
2.26%
jan 1, 1997
12.787
+0.253
2.02%
jan 1, 1998
13.054
+0.266
2.08%
jan 1, 1999
13.345
+0.291
2.23%
jan 1, 2000
13.63
+0.285
2.13%
jan 1, 2001
13.982
+0.352
2.58%
jan 1, 2002
14.324
+0.342
2.45%
jan 1, 2003
14.65
+0.326
2.27%
jan 1, 2004
14.934
+0.284
1.94%
jan 1, 2005
15.169
+0.236
1.58%
jan 1, 2006
15.378
+0.209
1.37%
jan 1, 2007
15.564
+0.186
1.21%
jan 1, 2008
15.738
+0.175
1.12%
jan 1, 2009
15.904
+0.166
1.05%
jan 1, 2010
15.845
-0.059
-0.37%
jan 1, 2011
15.972
+0.127
0.8%
jan 1, 2012
16.09
+0.118
0.74%
jan 1, 2013
16.205
+0.114
0.71%
jan 1, 2014
16.306
+0.102
0.63%
jan 1, 2015
16.394
+0.088
0.54%
jan 1, 2016
16.299
-0.095
-0.58%
Ranking of countries by current statistics by years


Comments: