29
/
en
AIzaSyAYiBZKx7MnpbEhh9jyipgxe19OcubqV5w
April 1, 2024
42817
Latin America & Caribbean (excluding high income)
LAC
false
2
1
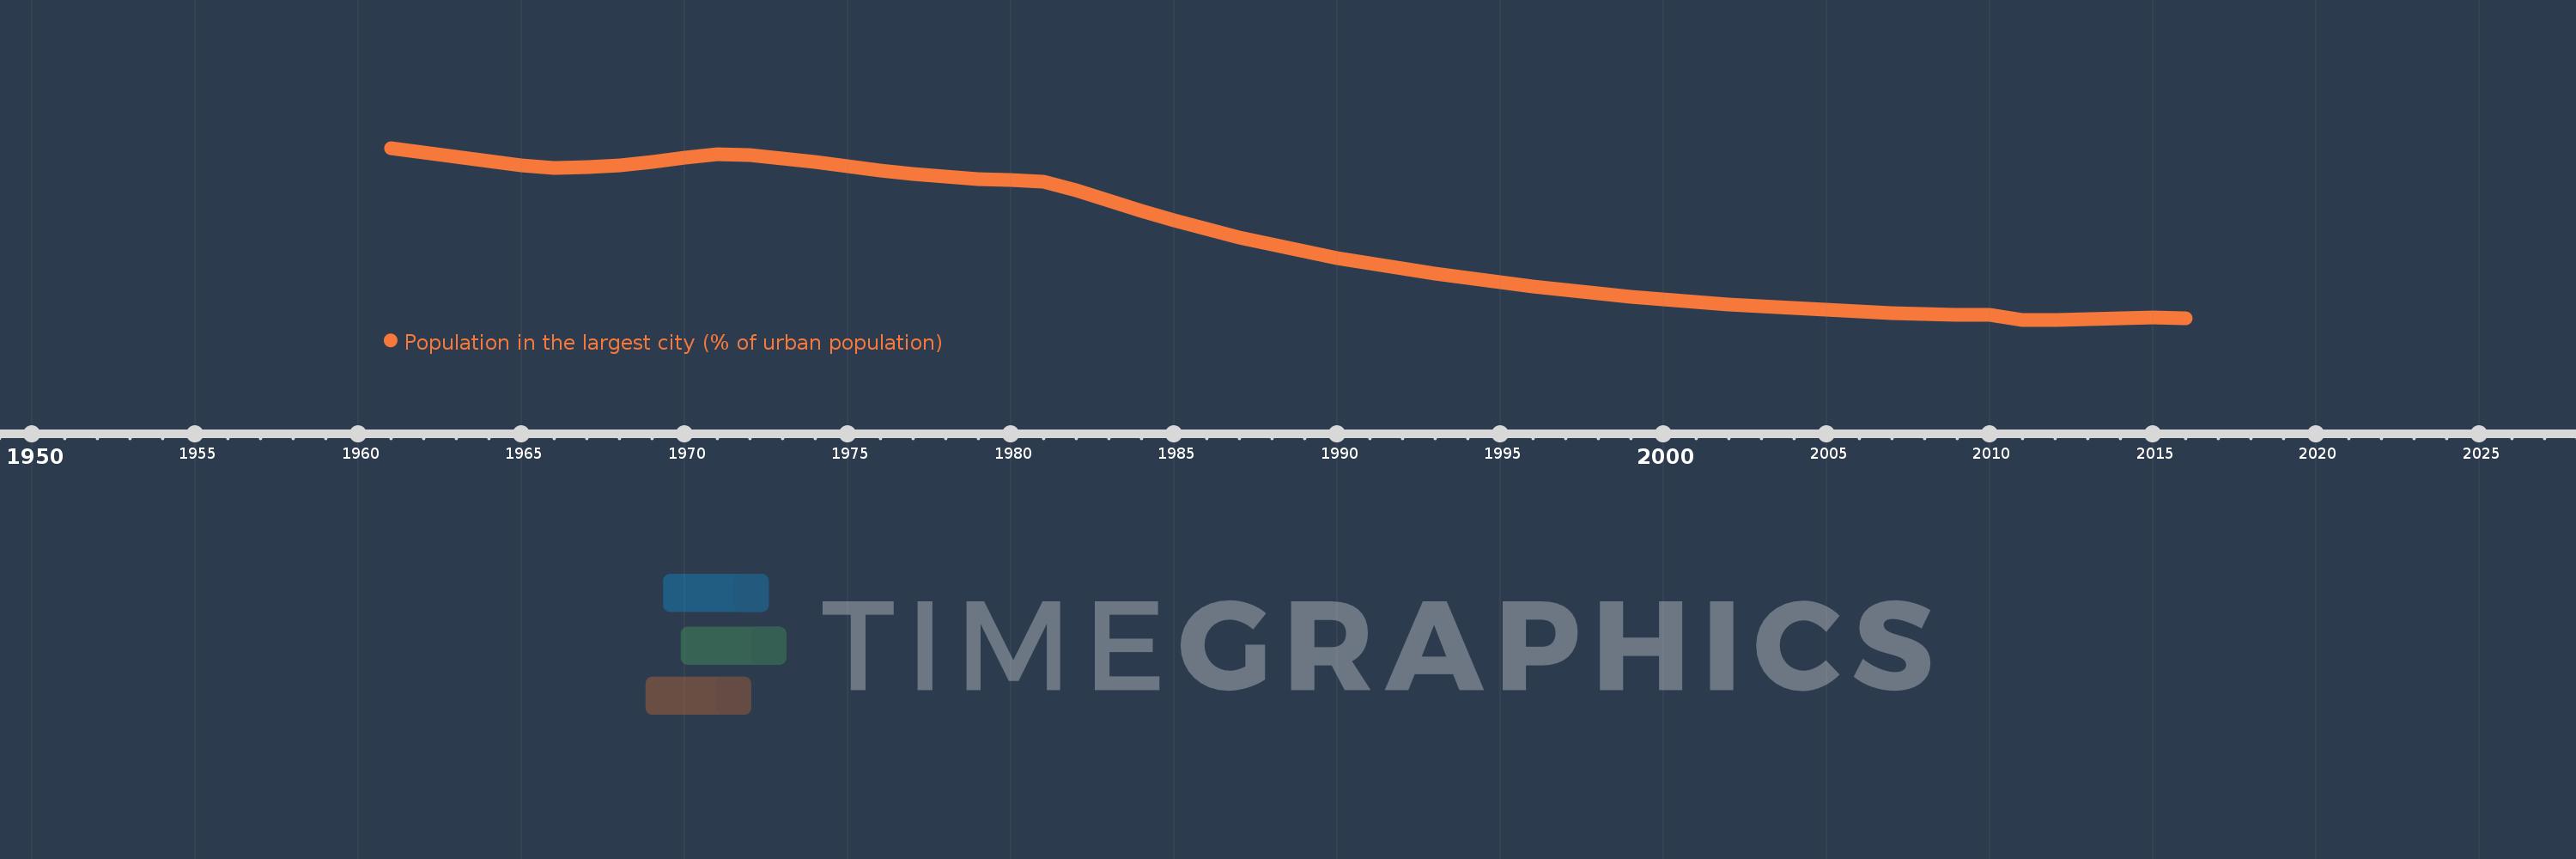
Population in the largest city (% of urban population)
2016,2015,2014,2013,2012,2011,2010,2009,2008,2007,2006,2005,2004,2003,2002,2001,2000,1999,1998,1997,1996,1995,1994,1993,1992,1991,1990,1989,1988,1987,1986,1985,1984,1983,1982,1981,1980,1979,1978,1977,1976,1975,1974,1973,1972,1971,1970,1969,1968,1967,1966,1965,1964,1963,1962,1961
This statistics in other country:
AfghanistanAlbaniaAlgeriaAngolaArab WorldArgentinaArmeniaAustraliaAustriaAzerbaijanBahrainBangladeshBelarusBelgiumBeninBoliviaBosnia and HerzegovinaBrazilBulgariaBurkina FasoBurundiCambodiaCameroonCanadaCentral African RepublicCentral Europe and the BalticsChadChileChinaColombiaCongo, Dem. Rep.Congo, Rep.Costa RicaCote d'IvoireCroatiaCubaCzech RepublicDenmarkDjiboutiDominican RepublicEarly-demographic dividendEast Asia & PacificEast Asia & Pacific (excluding high income)East Asia & Pacific (IDA & IBRD countries)EcuadorEgypt, Arab Rep.El SalvadorEritreaEstoniaEthiopiaEuro areaEurope & Central AsiaEurope & Central Asia (excluding high income)Europe & Central Asia (IDA & IBRD countries)European UnionFinlandFragile and conflict affected situationsFranceGabonGambia, TheGeorgiaGermanyGhanaGreeceGuatemalaGuineaGuinea-BissauHaitiHeavily indebted poor countries (HIPC)High incomeHondurasHong Kong SAR, ChinaHungaryIBRD onlyIDA & IBRD totalIDA blendIDA onlyIDA totalIndiaIndonesiaIran, Islamic Rep.IraqIrelandIsraelItalyJamaicaJapanJordanKazakhstanKenyaKorea, Dem. People’s Rep.Korea, Rep.KuwaitKyrgyz RepublicLao PDRLate-demographic dividendLatin America & Caribbean Latin America & Caribbean (excluding high income)Latin America & the Caribbean (IDA & IBRD countries)LatviaLeast developed countries: UN classificationLebanonLiberiaLibyaLithuaniaLow & middle incomeLow incomeLower middle incomeMacao SAR, ChinaMacedonia, FYRMadagascarMalawiMalaysiaMaliMauritaniaMexicoMiddle East & North AfricaMiddle East & North Africa (excluding high income)Middle East & North Africa (IDA & IBRD countries)Middle incomeMoldovaMongoliaMoroccoMozambiqueMyanmarNamibiaNepalNetherlandsNew ZealandNicaraguaNigerNigeriaNorth AmericaNorwayOECD membersOmanPakistanPanamaPapua New GuineaParaguayPeruPhilippinesPolandPortugalPost-demographic dividendPre-demographic dividendPuerto RicoQatarRomaniaRussian FederationRwandaSaudi ArabiaSenegalSerbiaSierra LeoneSingaporeSlovak RepublicSomaliaSouth AfricaSouth AsiaSouth Asia (IDA & IBRD)South SudanSpainSri LankaSub-Saharan Africa Sub-Saharan Africa (excluding high income)Sub-Saharan Africa (IDA & IBRD countries)SudanSwedenSwitzerlandSyrian Arab RepublicTajikistanTanzaniaThailandTogoTunisiaTurkeyTurkmenistanUgandaUkraineUnited Arab EmiratesUnited KingdomUnited StatesUpper middle incomeUruguayUzbekistanVenezuela, RBVietnamWest Bank and GazaWorldYemen, Rep.ZambiaZimbabwe Timeline:
This timeline shows a graph from 1961 to 2016 of Latin America & Caribbean (excluding high income). No data until 1960. Number of actual observations by date: 56.
Source name:
World Development Indicators
Source organization:
United Nations, World Urbanization Prospects.
Categories, topics:
Urban Development
Last updated:
apr 23, 2017
Indicators value changes by year
Minimum:
21.586
jan 1, 2011
Maximum:
26.553
jan 1, 1961
At the date of observation
Value
Absolute change
Change from previous value
jan 1, 1961
26.553
+26.553
0.0%
jan 1, 1962
26.433
-0.12
-0.45%
jan 1, 1963
26.296
-0.137
-0.52%
jan 1, 1964
26.167
-0.129
-0.49%
jan 1, 1965
26.054
-0.113
-0.43%
jan 1, 1966
25.965
-0.089
-0.34%
jan 1, 1967
25.987
+0.022
0.08%
jan 1, 1968
26.058
+0.071
0.27%
jan 1, 1969
26.153
+0.095
0.37%
jan 1, 1970
26.266
+0.113
0.43%
jan 1, 1971
26.374
+0.108
0.41%
jan 1, 1972
26.336
-0.038
-0.14%
jan 1, 1973
26.252
-0.084
-0.32%
jan 1, 1974
26.146
-0.105
-0.4%
jan 1, 1975
26.022
-0.125
-0.48%
jan 1, 1976
25.902
-0.12
-0.46%
jan 1, 1977
25.805
-0.097
-0.37%
jan 1, 1978
25.723
-0.082
-0.32%
jan 1, 1979
25.66
-0.063
-0.25%
jan 1, 1980
25.615
-0.045
-0.17%
jan 1, 1981
25.581
-0.035
-0.14%
jan 1, 1982
25.328
-0.253
-0.99%
jan 1, 1983
25.032
-0.296
-1.17%
jan 1, 1984
24.739
-0.293
-1.17%
jan 1, 1985
24.463
-0.276
-1.12%
jan 1, 1986
24.205
-0.258
-1.06%
jan 1, 1987
23.969
-0.236
-0.97%
jan 1, 1988
23.754
-0.215
-0.9%
jan 1, 1989
23.557
-0.197
-0.83%
jan 1, 1990
23.373
-0.184
-0.78%
jan 1, 1991
23.207
-0.166
-0.71%
jan 1, 1992
23.058
-0.149
-0.64%
jan 1, 1993
22.921
-0.137
-0.59%
jan 1, 1994
22.789
-0.133
-0.58%
jan 1, 1995
22.662
-0.127
-0.56%
jan 1, 1996
22.553
-0.109
-0.48%
jan 1, 1997
22.447
-0.106
-0.47%
jan 1, 1998
22.339
-0.108
-0.48%
jan 1, 1999
22.244
-0.095
-0.42%
jan 1, 2000
22.166
-0.078
-0.35%
jan 1, 2001
22.097
-0.069
-0.31%
jan 1, 2002
22.035
-0.062
-0.28%
jan 1, 2003
21.98
-0.054
-0.25%
jan 1, 2004
21.922
-0.059
-0.27%
jan 1, 2005
21.868
-0.053
-0.24%
jan 1, 2006
21.823
-0.045
-0.21%
jan 1, 2007
21.786
-0.037
-0.17%
jan 1, 2008
21.758
-0.028
-0.13%
jan 1, 2009
21.739
-0.019
-0.09%
jan 1, 2010
21.727
-0.011
-0.05%
jan 1, 2011
21.586
-0.142
-0.65%
jan 1, 2012
21.587
+0.002
0.01%
jan 1, 2013
21.598
+0.011
0.05%
jan 1, 2014
21.618
+0.02
0.09%
jan 1, 2015
21.648
+0.03
0.14%
jan 1, 2016
21.627
-0.021
-0.1%
Ranking of countries by current statistics by years


Comments: