29
/
en
AIzaSyAYiBZKx7MnpbEhh9jyipgxe19OcubqV5w
April 1, 2024
190720
Mali
MLI
true
2
1
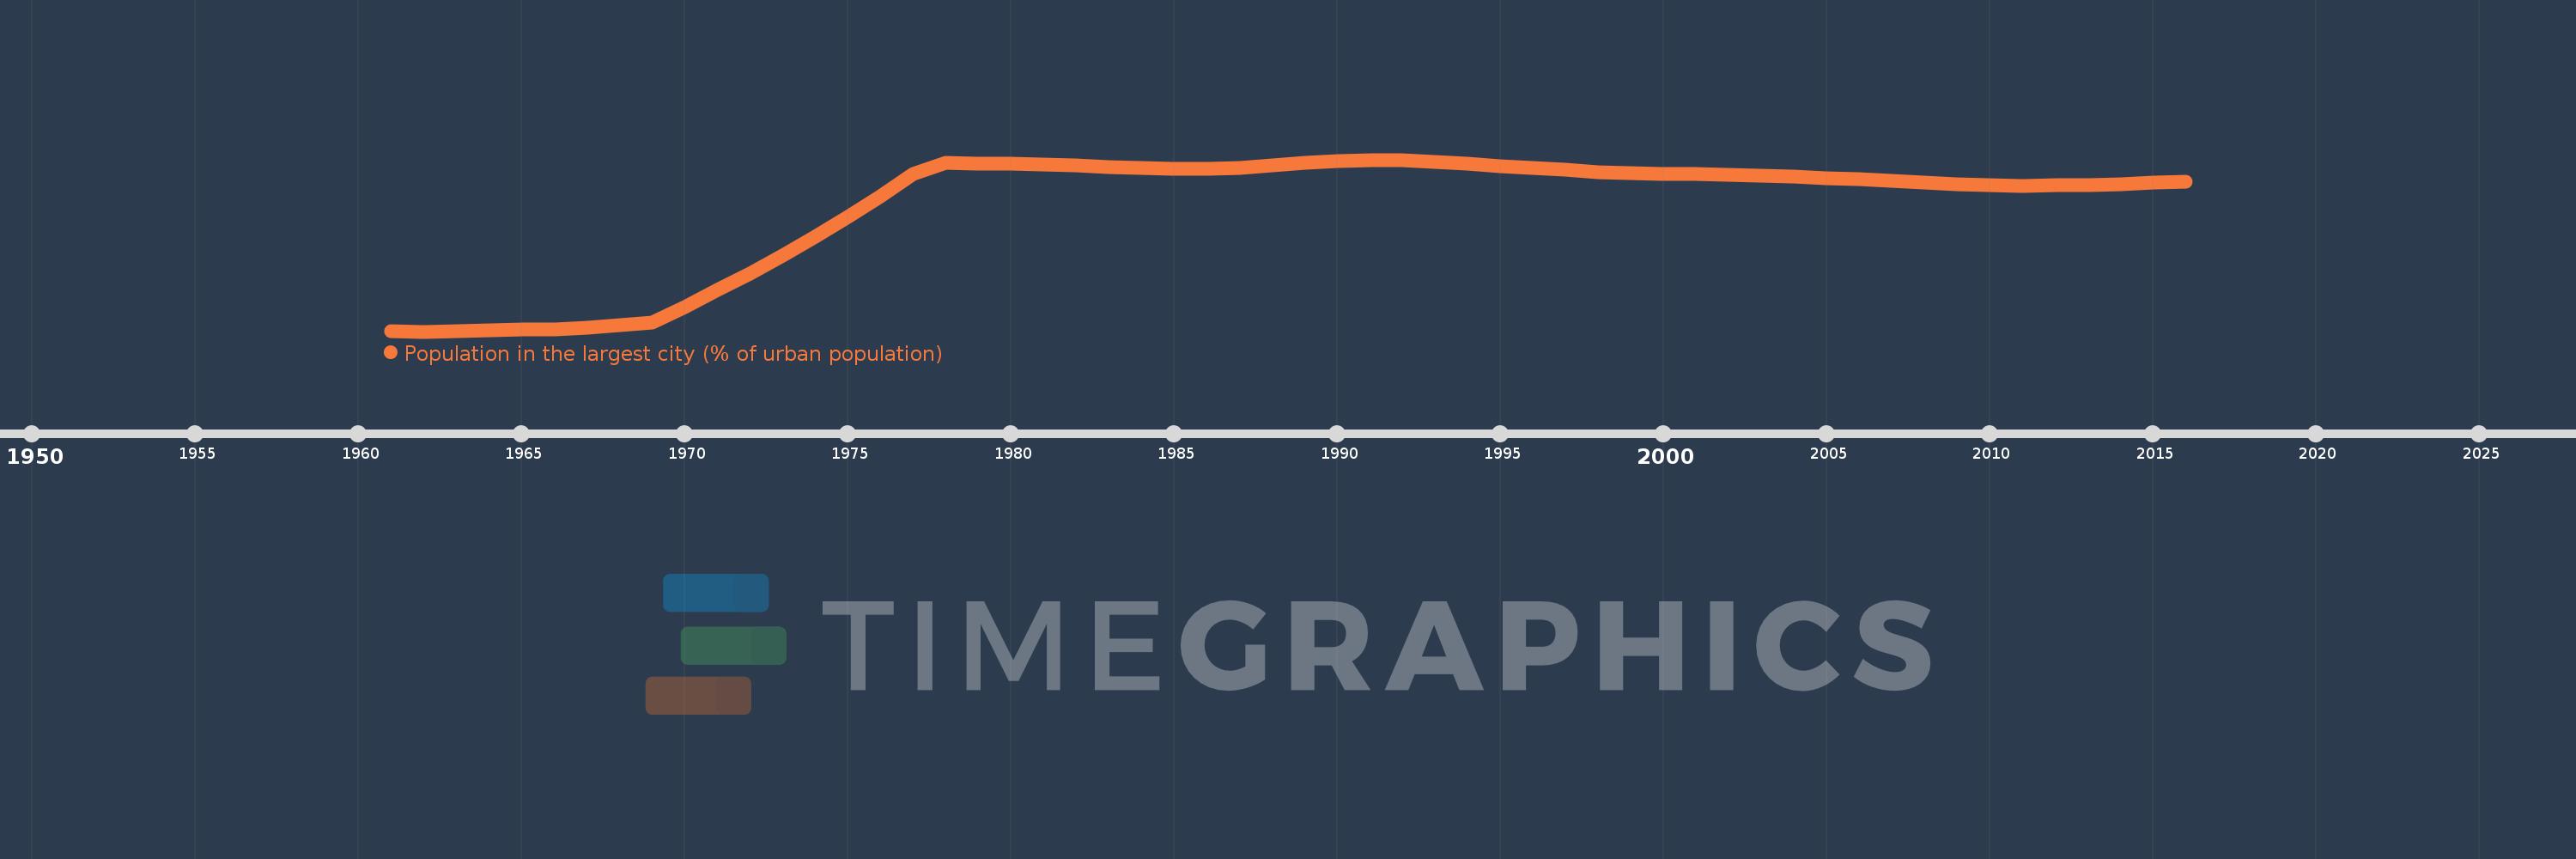
Population in the largest city (% of urban population)
2016,2015,2014,2013,2012,2011,2010,2009,2008,2007,2006,2005,2004,2003,2002,2001,2000,1999,1998,1997,1996,1995,1994,1993,1992,1991,1990,1989,1988,1987,1986,1985,1984,1983,1982,1981,1980,1979,1978,1977,1976,1975,1974,1973,1972,1971,1970,1969,1968,1967,1966,1965,1964,1963,1962,1961
This statistics in other country:
AfghanistanAlbaniaAlgeriaAngolaArab WorldArgentinaArmeniaAustraliaAustriaAzerbaijanBahrainBangladeshBelarusBelgiumBeninBoliviaBosnia and HerzegovinaBrazilBulgariaBurkina FasoBurundiCambodiaCameroonCanadaCentral African RepublicCentral Europe and the BalticsChadChileChinaColombiaCongo, Dem. Rep.Congo, Rep.Costa RicaCote d'IvoireCroatiaCubaCzech RepublicDenmarkDjiboutiDominican RepublicEarly-demographic dividendEast Asia & PacificEast Asia & Pacific (excluding high income)East Asia & Pacific (IDA & IBRD countries)EcuadorEgypt, Arab Rep.El SalvadorEritreaEstoniaEthiopiaEuro areaEurope & Central AsiaEurope & Central Asia (excluding high income)Europe & Central Asia (IDA & IBRD countries)European UnionFinlandFragile and conflict affected situationsFranceGabonGambia, TheGeorgiaGermanyGhanaGreeceGuatemalaGuineaGuinea-BissauHaitiHeavily indebted poor countries (HIPC)High incomeHondurasHong Kong SAR, ChinaHungaryIBRD onlyIDA & IBRD totalIDA blendIDA onlyIDA totalIndiaIndonesiaIran, Islamic Rep.IraqIrelandIsraelItalyJamaicaJapanJordanKazakhstanKenyaKorea, Dem. People’s Rep.Korea, Rep.KuwaitKyrgyz RepublicLao PDRLate-demographic dividendLatin America & Caribbean Latin America & Caribbean (excluding high income)Latin America & the Caribbean (IDA & IBRD countries)LatviaLeast developed countries: UN classificationLebanonLiberiaLibyaLithuaniaLow & middle incomeLow incomeLower middle incomeMacao SAR, ChinaMacedonia, FYRMadagascarMalawiMalaysiaMaliMauritaniaMexicoMiddle East & North AfricaMiddle East & North Africa (excluding high income)Middle East & North Africa (IDA & IBRD countries)Middle incomeMoldovaMongoliaMoroccoMozambiqueMyanmarNamibiaNepalNetherlandsNew ZealandNicaraguaNigerNigeriaNorth AmericaNorwayOECD membersOmanPakistanPanamaPapua New GuineaParaguayPeruPhilippinesPolandPortugalPost-demographic dividendPre-demographic dividendPuerto RicoQatarRomaniaRussian FederationRwandaSaudi ArabiaSenegalSerbiaSierra LeoneSingaporeSlovak RepublicSomaliaSouth AfricaSouth AsiaSouth Asia (IDA & IBRD)South SudanSpainSri LankaSub-Saharan Africa Sub-Saharan Africa (excluding high income)Sub-Saharan Africa (IDA & IBRD countries)SudanSwedenSwitzerlandSyrian Arab RepublicTajikistanTanzaniaThailandTogoTunisiaTurkeyTurkmenistanUgandaUkraineUnited Arab EmiratesUnited KingdomUnited StatesUpper middle incomeUruguayUzbekistanVenezuela, RBVietnamWest Bank and GazaWorldYemen, Rep.ZambiaZimbabwe Timeline:
This timeline shows a graph from 1961 to 2016 of Mali. No data until 1960. Number of actual observations by date: 56.
Source name:
World Development Indicators
Source organization:
United Nations, World Urbanization Prospects.
Categories, topics:
Urban Development
Last updated:
apr 23, 2017
Indicators value changes by year
Minimum:
22.291
jan 1, 1962
Maximum:
37.731
jan 1, 1991
At the date of observation
Value
Absolute change
Change from previous value
jan 1, 1961
22.321
+22.321
0.0%
jan 1, 1962
22.291
-0.03
-0.14%
jan 1, 1963
22.351
+0.06
0.27%
jan 1, 1964
22.41
+0.06
0.27%
jan 1, 1965
22.467
+0.057
0.25%
jan 1, 1966
22.518
+0.051
0.23%
jan 1, 1967
22.658
+0.141
0.62%
jan 1, 1968
22.893
+0.235
1.04%
jan 1, 1969
23.117
+0.224
0.98%
jan 1, 1970
24.526
+1.409
6.09%
jan 1, 1971
26.002
+1.476
6.02%
jan 1, 1972
27.539
+1.537
5.91%
jan 1, 1973
29.145
+1.607
5.83%
jan 1, 1974
30.822
+1.677
5.75%
jan 1, 1975
32.594
+1.772
5.75%
jan 1, 1976
34.473
+1.879
5.76%
jan 1, 1977
36.477
+2.004
5.81%
jan 1, 1978
37.429
+0.952
2.61%
jan 1, 1979
37.412
-0.017
-0.05%
jan 1, 1980
37.377
-0.035
-0.09%
jan 1, 1981
37.318
-0.058
-0.16%
jan 1, 1982
37.222
-0.096
-0.26%
jan 1, 1983
37.103
-0.119
-0.32%
jan 1, 1984
36.992
-0.112
-0.3%
jan 1, 1985
36.931
-0.061
-0.17%
jan 1, 1986
36.938
+0.007
0.02%
jan 1, 1987
37.029
+0.091
0.25%
jan 1, 1988
37.197
+0.167
0.45%
jan 1, 1989
37.45
+0.253
0.68%
jan 1, 1990
37.642
+0.192
0.51%
jan 1, 1991
37.731
+0.089
0.24%
jan 1, 1992
37.7
-0.031
-0.08%
jan 1, 1993
37.574
-0.126
-0.34%
jan 1, 1994
37.385
-0.189
-0.5%
jan 1, 1995
37.179
-0.206
-0.55%
jan 1, 1996
36.986
-0.192
-0.52%
jan 1, 1997
36.814
-0.173
-0.47%
jan 1, 1998
36.647
-0.167
-0.45%
jan 1, 1999
36.511
-0.135
-0.37%
jan 1, 2000
36.495
-0.016
-0.04%
jan 1, 2001
36.454
-0.041
-0.11%
jan 1, 2002
36.388
-0.066
-0.18%
jan 1, 2003
36.308
-0.08
-0.22%
jan 1, 2004
36.213
-0.095
-0.26%
jan 1, 2005
36.104
-0.11
-0.3%
jan 1, 2006
35.979
-0.125
-0.35%
jan 1, 2007
35.84
-0.138
-0.38%
jan 1, 2008
35.697
-0.143
-0.4%
jan 1, 2009
35.565
-0.132
-0.37%
jan 1, 2010
35.463
-0.103
-0.29%
jan 1, 2011
35.412
-0.051
-0.14%
jan 1, 2012
35.418
+0.006
0.02%
jan 1, 2013
35.473
+0.055
0.15%
jan 1, 2014
35.565
+0.093
0.26%
jan 1, 2015
35.677
+0.112
0.31%
jan 1, 2016
35.8
+0.123
0.35%
Ranking of countries by current statistics by years


Comments: