29
/
en
AIzaSyAYiBZKx7MnpbEhh9jyipgxe19OcubqV5w
April 1, 2024
107775
Colombia
COL
true
2
1
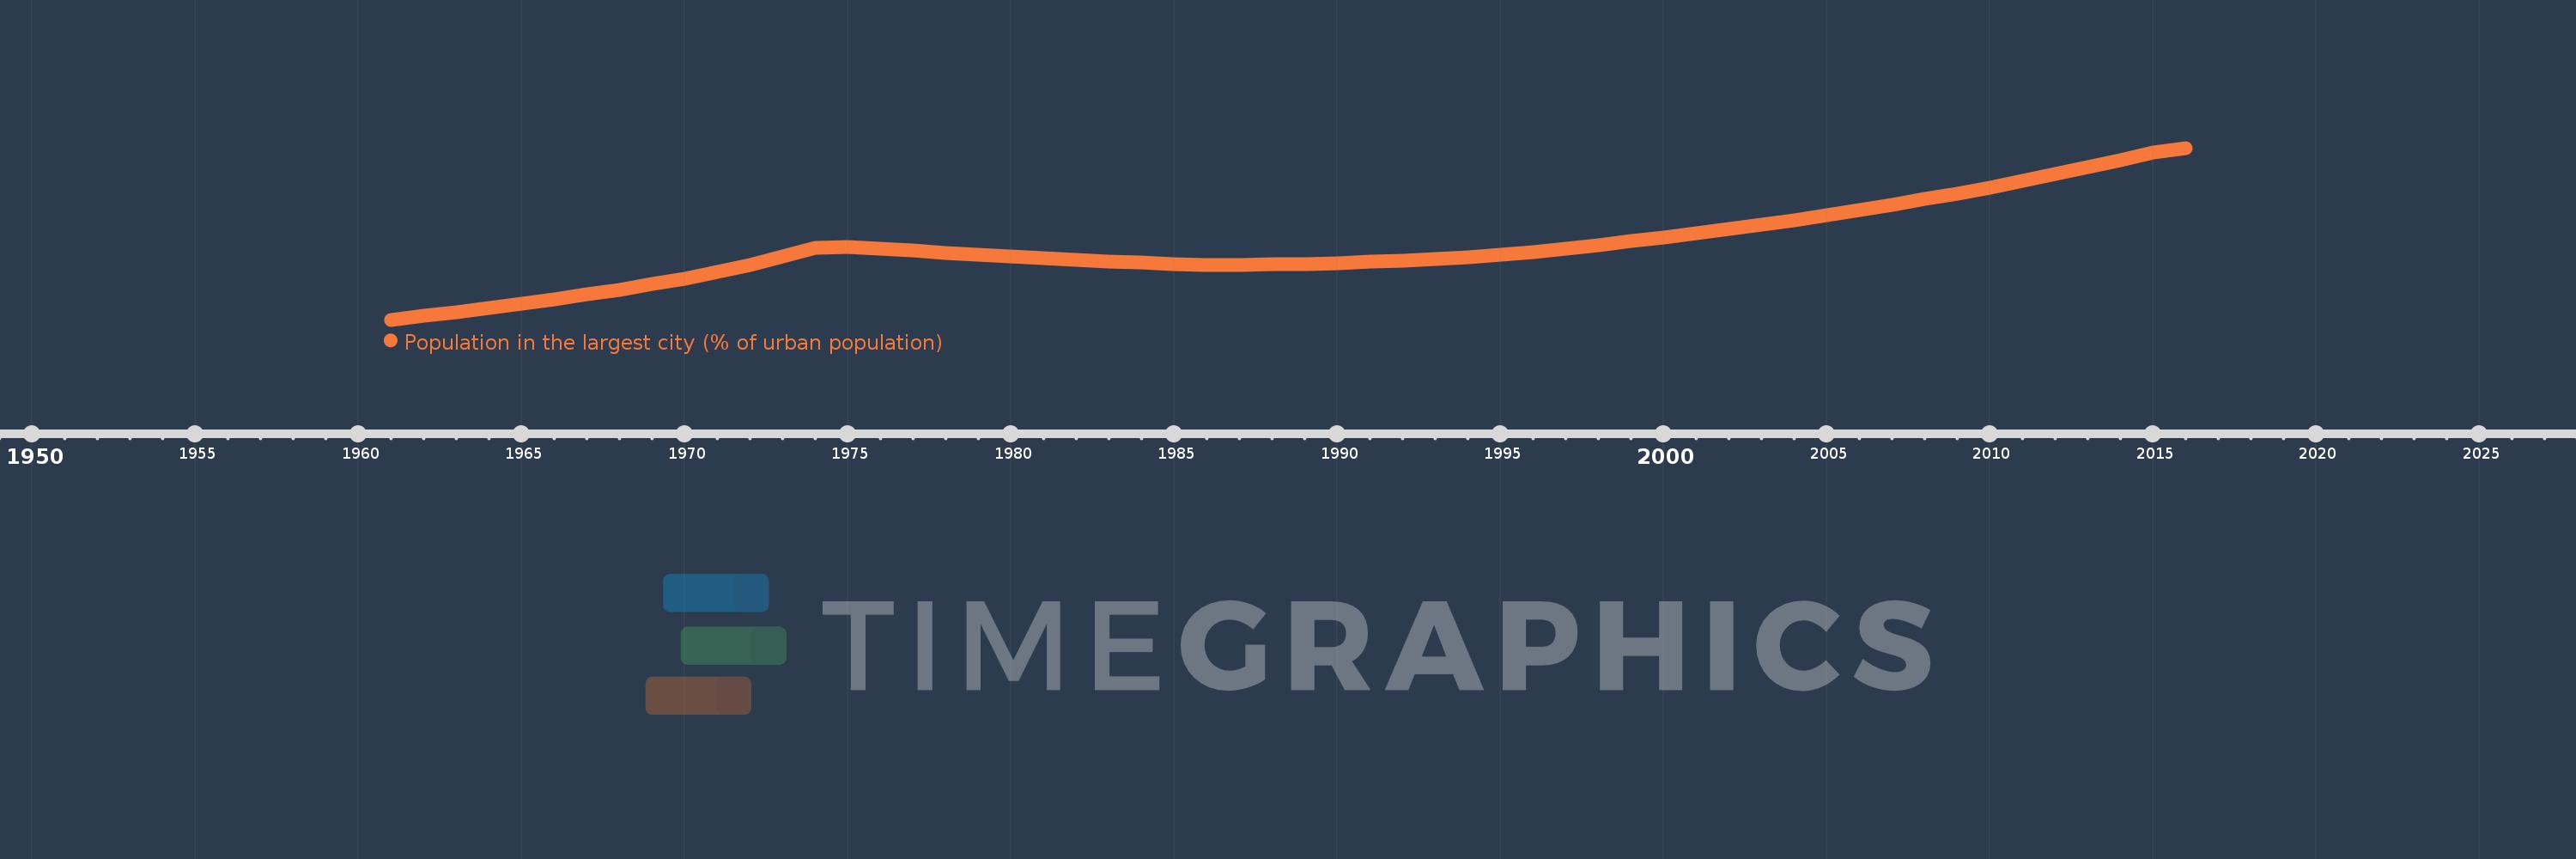
Population in the largest city (% of urban population)
2016,2015,2014,2013,2012,2011,2010,2009,2008,2007,2006,2005,2004,2003,2002,2001,2000,1999,1998,1997,1996,1995,1994,1993,1992,1991,1990,1989,1988,1987,1986,1985,1984,1983,1982,1981,1980,1979,1978,1977,1976,1975,1974,1973,1972,1971,1970,1969,1968,1967,1966,1965,1964,1963,1962,1961
This statistics in other country:
AfghanistanAlbaniaAlgeriaAngolaArab WorldArgentinaArmeniaAustraliaAustriaAzerbaijanBahrainBangladeshBelarusBelgiumBeninBoliviaBosnia and HerzegovinaBrazilBulgariaBurkina FasoBurundiCambodiaCameroonCanadaCentral African RepublicCentral Europe and the BalticsChadChileChinaColombiaCongo, Dem. Rep.Congo, Rep.Costa RicaCote d'IvoireCroatiaCubaCzech RepublicDenmarkDjiboutiDominican RepublicEarly-demographic dividendEast Asia & PacificEast Asia & Pacific (excluding high income)East Asia & Pacific (IDA & IBRD countries)EcuadorEgypt, Arab Rep.El SalvadorEritreaEstoniaEthiopiaEuro areaEurope & Central AsiaEurope & Central Asia (excluding high income)Europe & Central Asia (IDA & IBRD countries)European UnionFinlandFragile and conflict affected situationsFranceGabonGambia, TheGeorgiaGermanyGhanaGreeceGuatemalaGuineaGuinea-BissauHaitiHeavily indebted poor countries (HIPC)High incomeHondurasHong Kong SAR, ChinaHungaryIBRD onlyIDA & IBRD totalIDA blendIDA onlyIDA totalIndiaIndonesiaIran, Islamic Rep.IraqIrelandIsraelItalyJamaicaJapanJordanKazakhstanKenyaKorea, Dem. People’s Rep.Korea, Rep.KuwaitKyrgyz RepublicLao PDRLate-demographic dividendLatin America & Caribbean Latin America & Caribbean (excluding high income)Latin America & the Caribbean (IDA & IBRD countries)LatviaLeast developed countries: UN classificationLebanonLiberiaLibyaLithuaniaLow & middle incomeLow incomeLower middle incomeMacao SAR, ChinaMacedonia, FYRMadagascarMalawiMalaysiaMaliMauritaniaMexicoMiddle East & North AfricaMiddle East & North Africa (excluding high income)Middle East & North Africa (IDA & IBRD countries)Middle incomeMoldovaMongoliaMoroccoMozambiqueMyanmarNamibiaNepalNetherlandsNew ZealandNicaraguaNigerNigeriaNorth AmericaNorwayOECD membersOmanPakistanPanamaPapua New GuineaParaguayPeruPhilippinesPolandPortugalPost-demographic dividendPre-demographic dividendPuerto RicoQatarRomaniaRussian FederationRwandaSaudi ArabiaSenegalSerbiaSierra LeoneSingaporeSlovak RepublicSomaliaSouth AfricaSouth AsiaSouth Asia (IDA & IBRD)South SudanSpainSri LankaSub-Saharan Africa Sub-Saharan Africa (excluding high income)Sub-Saharan Africa (IDA & IBRD countries)SudanSwedenSwitzerlandSyrian Arab RepublicTajikistanTanzaniaThailandTogoTunisiaTurkeyTurkmenistanUgandaUkraineUnited Arab EmiratesUnited KingdomUnited StatesUpper middle incomeUruguayUzbekistanVenezuela, RBVietnamWest Bank and GazaWorldYemen, Rep.ZambiaZimbabwe Timeline:
This timeline shows a graph from 1961 to 2016 of Colombia. No data until 1960. Number of actual observations by date: 56.
Source name:
World Development Indicators
Source organization:
United Nations, World Urbanization Prospects.
Categories, topics:
Urban Development
Last updated:
apr 23, 2017
Indicators value changes by year
Minimum:
17.094
jan 1, 1961
Maximum:
26.489
jan 1, 2016
At the date of observation
Value
Absolute change
Change from previous value
jan 1, 1961
17.094
+17.094
0.0%
jan 1, 1962
17.292
+0.198
1.16%
jan 1, 1963
17.504
+0.212
1.23%
jan 1, 1964
17.732
+0.227
1.3%
jan 1, 1965
17.976
+0.245
1.38%
jan 1, 1966
18.221
+0.245
1.36%
jan 1, 1967
18.475
+0.255
1.4%
jan 1, 1968
18.742
+0.267
1.45%
jan 1, 1969
19.031
+0.289
1.54%
jan 1, 1970
19.35
+0.318
1.67%
jan 1, 1971
19.708
+0.358
1.85%
jan 1, 1972
20.108
+0.4
2.03%
jan 1, 1973
20.548
+0.44
2.19%
jan 1, 1974
21.017
+0.47
2.29%
jan 1, 1975
21.092
+0.075
0.36%
jan 1, 1976
20.98
-0.113
-0.53%
jan 1, 1977
20.868
-0.112
-0.53%
jan 1, 1978
20.759
-0.109
-0.52%
jan 1, 1979
20.654
-0.105
-0.51%
jan 1, 1980
20.553
-0.101
-0.49%
jan 1, 1981
20.458
-0.095
-0.46%
jan 1, 1982
20.368
-0.09
-0.44%
jan 1, 1983
20.283
-0.084
-0.41%
jan 1, 1984
20.208
-0.075
-0.37%
jan 1, 1985
20.145
-0.063
-0.31%
jan 1, 1986
20.097
-0.049
-0.24%
jan 1, 1987
20.094
-0.003
-0.02%
jan 1, 1988
20.116
+0.023
0.11%
jan 1, 1989
20.153
+0.036
0.18%
jan 1, 1990
20.2
+0.047
0.23%
jan 1, 1991
20.259
+0.059
0.29%
jan 1, 1992
20.329
+0.07
0.34%
jan 1, 1993
20.411
+0.082
0.41%
jan 1, 1994
20.505
+0.094
0.46%
jan 1, 1995
20.643
+0.138
0.67%
jan 1, 1996
20.808
+0.165
0.8%
jan 1, 1997
20.988
+0.18
0.87%
jan 1, 1998
21.181
+0.192
0.92%
jan 1, 1999
21.386
+0.206
0.97%
jan 1, 2000
21.602
+0.215
1.01%
jan 1, 2001
21.826
+0.224
1.04%
jan 1, 2002
22.056
+0.231
1.06%
jan 1, 2003
22.296
+0.24
1.09%
jan 1, 2004
22.547
+0.25
1.12%
jan 1, 2005
22.81
+0.263
1.17%
jan 1, 2006
23.085
+0.275
1.21%
jan 1, 2007
23.376
+0.291
1.26%
jan 1, 2008
23.681
+0.305
1.3%
jan 1, 2009
24.002
+0.321
1.36%
jan 1, 2010
24.336
+0.334
1.39%
jan 1, 2011
24.687
+0.351
1.44%
jan 1, 2012
25.054
+0.367
1.49%
jan 1, 2013
25.439
+0.385
1.53%
jan 1, 2014
25.84
+0.401
1.58%
jan 1, 2015
26.258
+0.418
1.62%
jan 1, 2016
26.489
+0.23
0.88%
Ranking of countries by current statistics by years


Comments: