29
/
en
AIzaSyAYiBZKx7MnpbEhh9jyipgxe19OcubqV5w
April 1, 2024
222709
Peru
PER
true
2
1
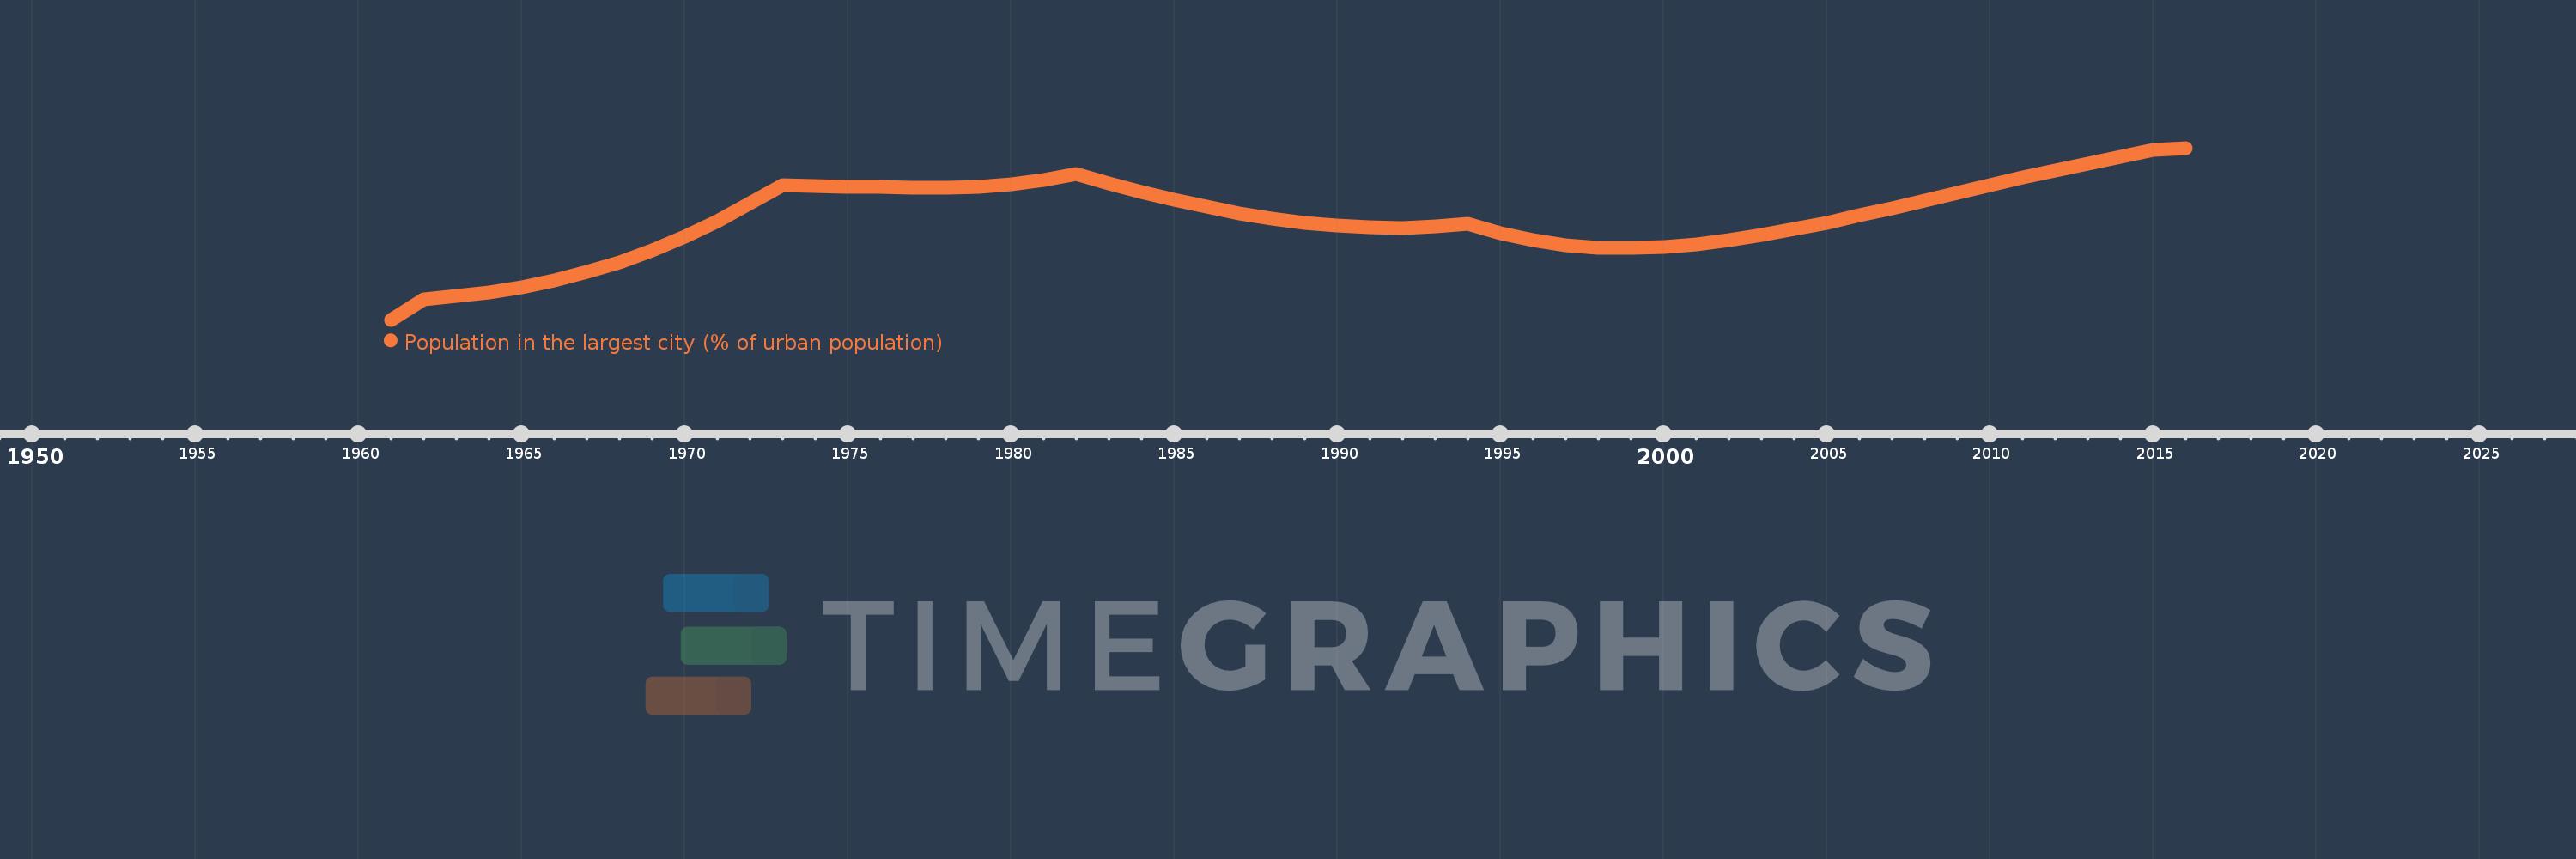
Population in the largest city (% of urban population)
2016,2015,2014,2013,2012,2011,2010,2009,2008,2007,2006,2005,2004,2003,2002,2001,2000,1999,1998,1997,1996,1995,1994,1993,1992,1991,1990,1989,1988,1987,1986,1985,1984,1983,1982,1981,1980,1979,1978,1977,1976,1975,1974,1973,1972,1971,1970,1969,1968,1967,1966,1965,1964,1963,1962,1961
This statistics in other country:
AfghanistanAlbaniaAlgeriaAngolaArab WorldArgentinaArmeniaAustraliaAustriaAzerbaijanBahrainBangladeshBelarusBelgiumBeninBoliviaBosnia and HerzegovinaBrazilBulgariaBurkina FasoBurundiCambodiaCameroonCanadaCentral African RepublicCentral Europe and the BalticsChadChileChinaColombiaCongo, Dem. Rep.Congo, Rep.Costa RicaCote d'IvoireCroatiaCubaCzech RepublicDenmarkDjiboutiDominican RepublicEarly-demographic dividendEast Asia & PacificEast Asia & Pacific (excluding high income)East Asia & Pacific (IDA & IBRD countries)EcuadorEgypt, Arab Rep.El SalvadorEritreaEstoniaEthiopiaEuro areaEurope & Central AsiaEurope & Central Asia (excluding high income)Europe & Central Asia (IDA & IBRD countries)European UnionFinlandFragile and conflict affected situationsFranceGabonGambia, TheGeorgiaGermanyGhanaGreeceGuatemalaGuineaGuinea-BissauHaitiHeavily indebted poor countries (HIPC)High incomeHondurasHong Kong SAR, ChinaHungaryIBRD onlyIDA & IBRD totalIDA blendIDA onlyIDA totalIndiaIndonesiaIran, Islamic Rep.IraqIrelandIsraelItalyJamaicaJapanJordanKazakhstanKenyaKorea, Dem. People’s Rep.Korea, Rep.KuwaitKyrgyz RepublicLao PDRLate-demographic dividendLatin America & Caribbean Latin America & Caribbean (excluding high income)Latin America & the Caribbean (IDA & IBRD countries)LatviaLeast developed countries: UN classificationLebanonLiberiaLibyaLithuaniaLow & middle incomeLow incomeLower middle incomeMacao SAR, ChinaMacedonia, FYRMadagascarMalawiMalaysiaMaliMauritaniaMexicoMiddle East & North AfricaMiddle East & North Africa (excluding high income)Middle East & North Africa (IDA & IBRD countries)Middle incomeMoldovaMongoliaMoroccoMozambiqueMyanmarNamibiaNepalNetherlandsNew ZealandNicaraguaNigerNigeriaNorth AmericaNorwayOECD membersOmanPakistanPanamaPapua New GuineaParaguayPeruPhilippinesPolandPortugalPost-demographic dividendPre-demographic dividendPuerto RicoQatarRomaniaRussian FederationRwandaSaudi ArabiaSenegalSerbiaSierra LeoneSingaporeSlovak RepublicSomaliaSouth AfricaSouth AsiaSouth Asia (IDA & IBRD)South SudanSpainSri LankaSub-Saharan Africa Sub-Saharan Africa (excluding high income)Sub-Saharan Africa (IDA & IBRD countries)SudanSwedenSwitzerlandSyrian Arab RepublicTajikistanTanzaniaThailandTogoTunisiaTurkeyTurkmenistanUgandaUkraineUnited Arab EmiratesUnited KingdomUnited StatesUpper middle incomeUruguayUzbekistanVenezuela, RBVietnamWest Bank and GazaWorldYemen, Rep.ZambiaZimbabwe Timeline:
This timeline shows a graph from 1961 to 2016 of Peru. No data until 1960. Number of actual observations by date: 56.
Source name:
World Development Indicators
Source organization:
United Nations, World Urbanization Prospects.
Categories, topics:
Urban Development
Last updated:
apr 23, 2017
Indicators value changes by year
Minimum:
37.281
jan 1, 1961
Maximum:
40.126
jan 1, 2016
At the date of observation
Value
Absolute change
Change from previous value
jan 1, 1961
37.281
+37.281
0.0%
jan 1, 1962
37.622
+0.34
0.91%
jan 1, 1963
37.673
+0.051
0.14%
jan 1, 1964
37.737
+0.064
0.17%
jan 1, 1965
37.823
+0.086
0.23%
jan 1, 1966
37.932
+0.109
0.29%
jan 1, 1967
38.07
+0.138
0.36%
jan 1, 1968
38.235
+0.165
0.43%
jan 1, 1969
38.431
+0.196
0.51%
jan 1, 1970
38.656
+0.225
0.59%
jan 1, 1971
38.915
+0.26
0.67%
jan 1, 1972
39.211
+0.296
0.76%
jan 1, 1973
39.517
+0.306
0.78%
jan 1, 1974
39.499
-0.019
-0.05%
jan 1, 1975
39.488
-0.011
-0.03%
jan 1, 1976
39.48
-0.008
-0.02%
jan 1, 1977
39.474
-0.006
-0.01%
jan 1, 1978
39.471
-0.003
-0.01%
jan 1, 1979
39.484
+0.013
0.03%
jan 1, 1980
39.52
+0.036
0.09%
jan 1, 1981
39.589
+0.069
0.18%
jan 1, 1982
39.689
+0.1
0.25%
jan 1, 1983
39.533
-0.156
-0.39%
jan 1, 1984
39.39
-0.143
-0.36%
jan 1, 1985
39.265
-0.125
-0.32%
jan 1, 1986
39.148
-0.116
-0.3%
jan 1, 1987
39.045
-0.103
-0.26%
jan 1, 1988
38.958
-0.088
-0.22%
jan 1, 1989
38.888
-0.069
-0.18%
jan 1, 1990
38.837
-0.051
-0.13%
jan 1, 1991
38.81
-0.027
-0.07%
jan 1, 1992
38.805
-0.005
-0.01%
jan 1, 1993
38.825
+0.02
0.05%
jan 1, 1994
38.872
+0.048
0.12%
jan 1, 1995
38.715
-0.158
-0.41%
jan 1, 1996
38.593
-0.122
-0.32%
jan 1, 1997
38.514
-0.079
-0.2%
jan 1, 1998
38.473
-0.041
-0.11%
jan 1, 1999
38.466
-0.007
-0.02%
jan 1, 2000
38.487
+0.021
0.05%
jan 1, 2001
38.532
+0.045
0.12%
jan 1, 2002
38.596
+0.064
0.17%
jan 1, 2003
38.68
+0.085
0.22%
jan 1, 2004
38.78
+0.099
0.26%
jan 1, 2005
38.891
+0.111
0.29%
jan 1, 2006
39.007
+0.116
0.3%
jan 1, 2007
39.131
+0.123
0.32%
jan 1, 2008
39.259
+0.128
0.33%
jan 1, 2009
39.388
+0.129
0.33%
jan 1, 2010
39.515
+0.127
0.32%
jan 1, 2011
39.637
+0.121
0.31%
jan 1, 2012
39.752
+0.115
0.29%
jan 1, 2013
39.861
+0.109
0.28%
jan 1, 2014
39.973
+0.112
0.28%
jan 1, 2015
40.095
+0.122
0.31%
jan 1, 2016
40.126
+0.031
0.08%
Ranking of countries by current statistics by years


Comments: