29
/
en
AIzaSyAYiBZKx7MnpbEhh9jyipgxe19OcubqV5w
April 1, 2024
275139
United Arab Emirates
ARE
true
2
1
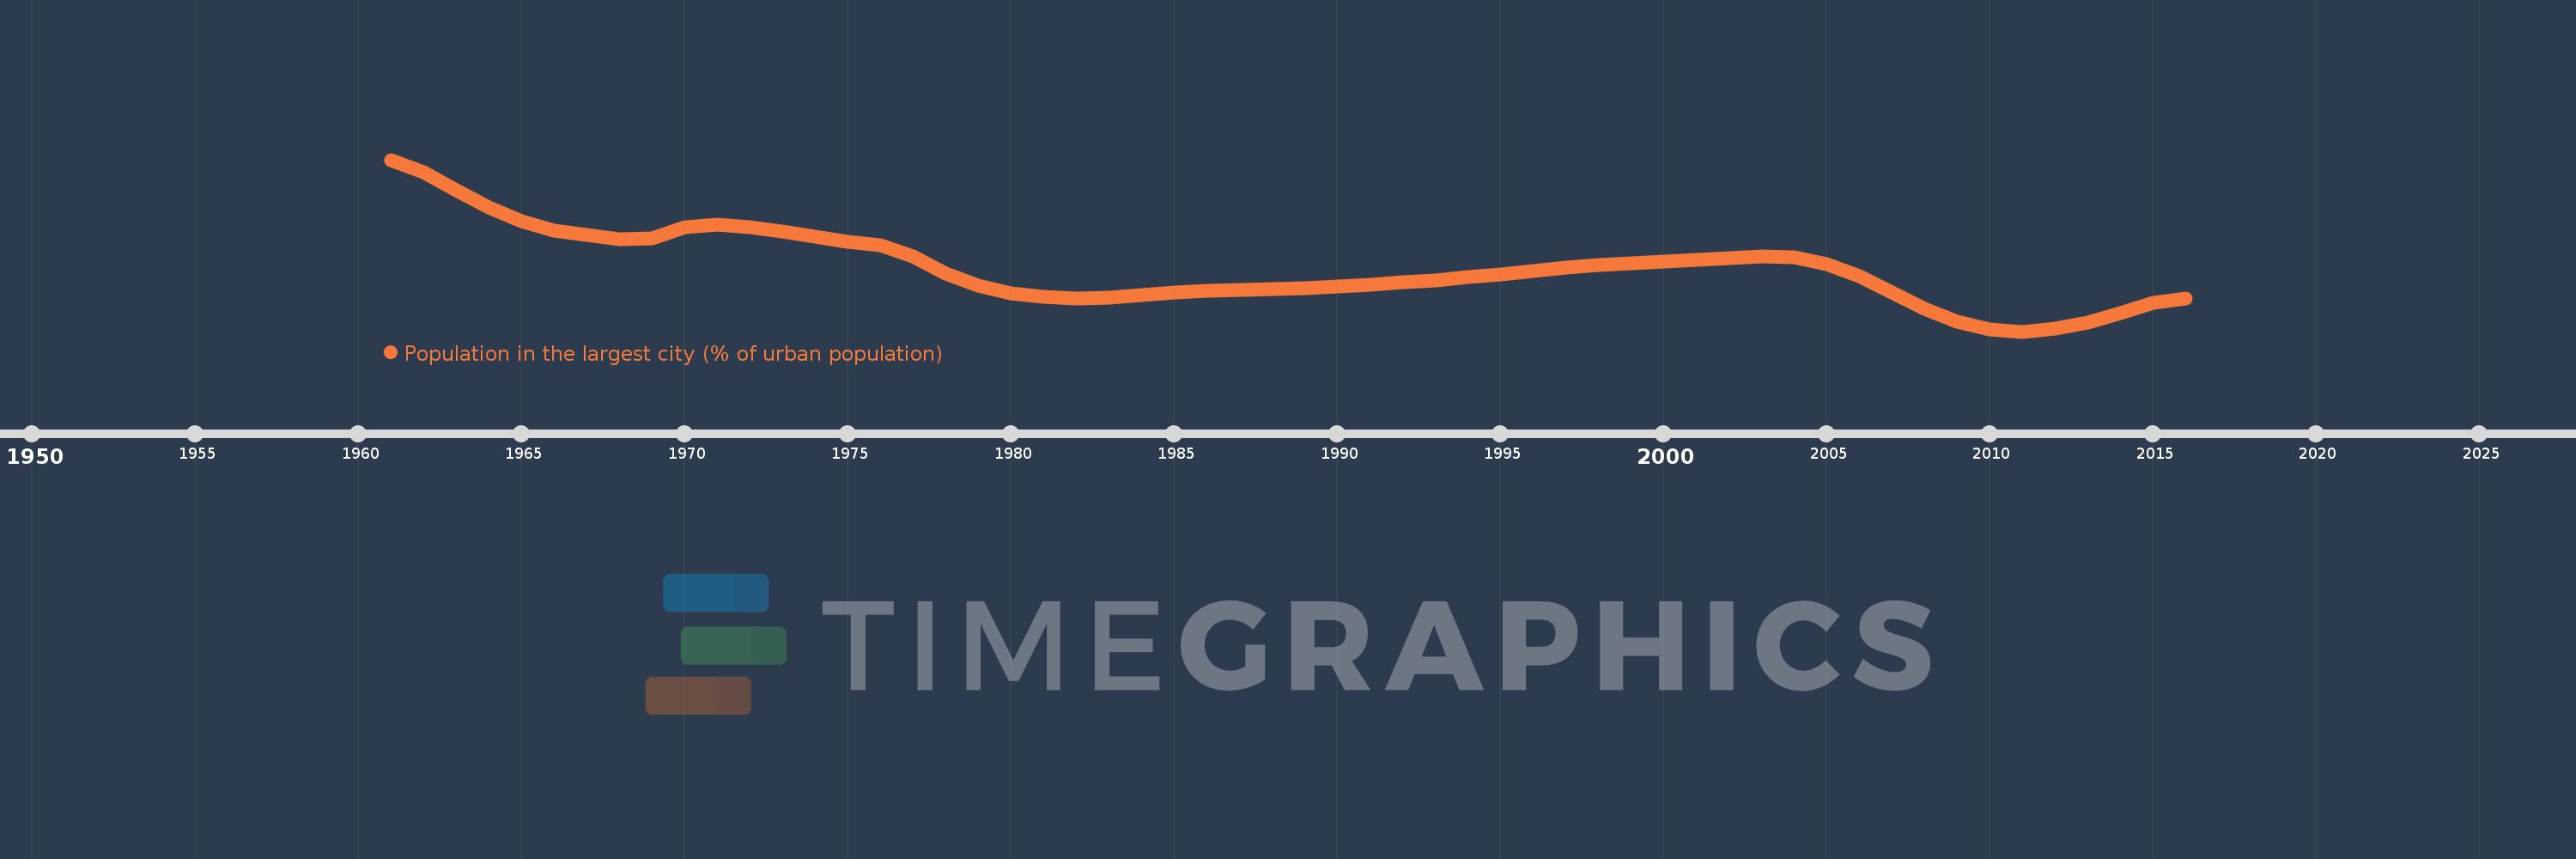
Population in the largest city (% of urban population)
2016,2015,2014,2013,2012,2011,2010,2009,2008,2007,2006,2005,2004,2003,2002,2001,2000,1999,1998,1997,1996,1995,1994,1993,1992,1991,1990,1989,1988,1987,1986,1985,1984,1983,1982,1981,1980,1979,1978,1977,1976,1975,1974,1973,1972,1971,1970,1969,1968,1967,1966,1965,1964,1963,1962,1961
This statistics in other country:
AfghanistanAlbaniaAlgeriaAngolaArab WorldArgentinaArmeniaAustraliaAustriaAzerbaijanBahrainBangladeshBelarusBelgiumBeninBoliviaBosnia and HerzegovinaBrazilBulgariaBurkina FasoBurundiCambodiaCameroonCanadaCentral African RepublicCentral Europe and the BalticsChadChileChinaColombiaCongo, Dem. Rep.Congo, Rep.Costa RicaCote d'IvoireCroatiaCubaCzech RepublicDenmarkDjiboutiDominican RepublicEarly-demographic dividendEast Asia & PacificEast Asia & Pacific (excluding high income)East Asia & Pacific (IDA & IBRD countries)EcuadorEgypt, Arab Rep.El SalvadorEritreaEstoniaEthiopiaEuro areaEurope & Central AsiaEurope & Central Asia (excluding high income)Europe & Central Asia (IDA & IBRD countries)European UnionFinlandFragile and conflict affected situationsFranceGabonGambia, TheGeorgiaGermanyGhanaGreeceGuatemalaGuineaGuinea-BissauHaitiHeavily indebted poor countries (HIPC)High incomeHondurasHong Kong SAR, ChinaHungaryIBRD onlyIDA & IBRD totalIDA blendIDA onlyIDA totalIndiaIndonesiaIran, Islamic Rep.IraqIrelandIsraelItalyJamaicaJapanJordanKazakhstanKenyaKorea, Dem. People’s Rep.Korea, Rep.KuwaitKyrgyz RepublicLao PDRLate-demographic dividendLatin America & Caribbean Latin America & Caribbean (excluding high income)Latin America & the Caribbean (IDA & IBRD countries)LatviaLeast developed countries: UN classificationLebanonLiberiaLibyaLithuaniaLow & middle incomeLow incomeLower middle incomeMacao SAR, ChinaMacedonia, FYRMadagascarMalawiMalaysiaMaliMauritaniaMexicoMiddle East & North AfricaMiddle East & North Africa (excluding high income)Middle East & North Africa (IDA & IBRD countries)Middle incomeMoldovaMongoliaMoroccoMozambiqueMyanmarNamibiaNepalNetherlandsNew ZealandNicaraguaNigerNigeriaNorth AmericaNorwayOECD membersOmanPakistanPanamaPapua New GuineaParaguayPeruPhilippinesPolandPortugalPost-demographic dividendPre-demographic dividendPuerto RicoQatarRomaniaRussian FederationRwandaSaudi ArabiaSenegalSerbiaSierra LeoneSingaporeSlovak RepublicSomaliaSouth AfricaSouth AsiaSouth Asia (IDA & IBRD)South SudanSpainSri LankaSub-Saharan Africa Sub-Saharan Africa (excluding high income)Sub-Saharan Africa (IDA & IBRD countries)SudanSwedenSwitzerlandSyrian Arab RepublicTajikistanTanzaniaThailandTogoTunisiaTurkeyTurkmenistanUgandaUkraineUnited Arab EmiratesUnited KingdomUnited StatesUpper middle incomeUruguayUzbekistanVenezuela, RBVietnamWest Bank and GazaWorldYemen, Rep.ZambiaZimbabwe Timeline:
This timeline shows a graph from 1961 to 2016 of United Arab Emirates. No data until 1960. Number of actual observations by date: 56.
Source name:
World Development Indicators
Source organization:
United Nations, World Urbanization Prospects.
Categories, topics:
Urban Development
Last updated:
apr 23, 2017
Indicators value changes by year
Minimum:
25.393
jan 1, 2011
Maximum:
53.349
jan 1, 1961
At the date of observation
Value
Absolute change
Change from previous value
jan 1, 1961
53.349
+53.349
0.0%
jan 1, 1962
51.313
-2.037
-3.82%
jan 1, 1963
48.442
-2.871
-5.59%
jan 1, 1964
45.578
-2.864
-5.91%
jan 1, 1965
43.361
-2.217
-4.86%
jan 1, 1966
41.88
-1.481
-3.42%
jan 1, 1967
41.07
-0.81
-1.93%
jan 1, 1968
40.483
-0.586
-1.43%
jan 1, 1969
40.599
+0.115
0.28%
jan 1, 1970
42.357
+1.759
4.33%
jan 1, 1971
42.813
+0.456
1.08%
jan 1, 1972
42.405
-0.408
-0.95%
jan 1, 1973
41.688
-0.717
-1.69%
jan 1, 1974
40.843
-0.845
-2.03%
jan 1, 1975
40.048
-0.795
-1.95%
jan 1, 1976
39.438
-0.61
-1.52%
jan 1, 1977
37.619
-1.819
-4.61%
jan 1, 1978
34.87
-2.749
-7.31%
jan 1, 1979
32.817
-2.053
-5.89%
jan 1, 1980
31.544
-1.273
-3.88%
jan 1, 1981
30.995
-0.549
-1.74%
jan 1, 1982
30.844
-0.151
-0.49%
jan 1, 1983
30.96
+0.115
0.37%
jan 1, 1984
31.32
+0.36
1.16%
jan 1, 1985
31.707
+0.387
1.24%
jan 1, 1986
31.977
+0.27
0.85%
jan 1, 1987
32.174
+0.198
0.62%
jan 1, 1988
32.349
+0.175
0.54%
jan 1, 1989
32.508
+0.159
0.49%
jan 1, 1990
32.713
+0.204
0.63%
jan 1, 1991
33.01
+0.298
0.91%
jan 1, 1992
33.37
+0.359
1.09%
jan 1, 1993
33.763
+0.394
1.18%
jan 1, 1994
34.201
+0.438
1.3%
jan 1, 1995
34.715
+0.514
1.5%
jan 1, 1996
35.3
+0.586
1.69%
jan 1, 1997
35.816
+0.516
1.46%
jan 1, 1998
36.208
+0.392
1.09%
jan 1, 1999
36.551
+0.343
0.95%
jan 1, 2000
36.845
+0.294
0.8%
jan 1, 2001
37.06
+0.215
0.58%
jan 1, 2002
37.364
+0.304
0.82%
jan 1, 2003
37.686
+0.322
0.86%
jan 1, 2004
37.535
-0.152
-0.4%
jan 1, 2005
36.426
-1.109
-2.95%
jan 1, 2006
34.385
-2.041
-5.6%
jan 1, 2007
31.73
-2.654
-7.72%
jan 1, 2008
29.083
-2.647
-8.34%
jan 1, 2009
26.992
-2.091
-7.19%
jan 1, 2010
25.755
-1.237
-4.58%
jan 1, 2011
25.393
-0.362
-1.4%
jan 1, 2012
25.813
+0.419
1.65%
jan 1, 2013
26.853
+1.04
4.03%
jan 1, 2014
28.353
+1.501
5.59%
jan 1, 2015
30.081
+1.728
6.09%
jan 1, 2016
30.826
+0.745
2.48%
Ranking of countries by current statistics by years


Comments: