29
/
en
AIzaSyAYiBZKx7MnpbEhh9jyipgxe19OcubqV5w
April 1, 2024
71654
Armenia
ARM
true
2
1
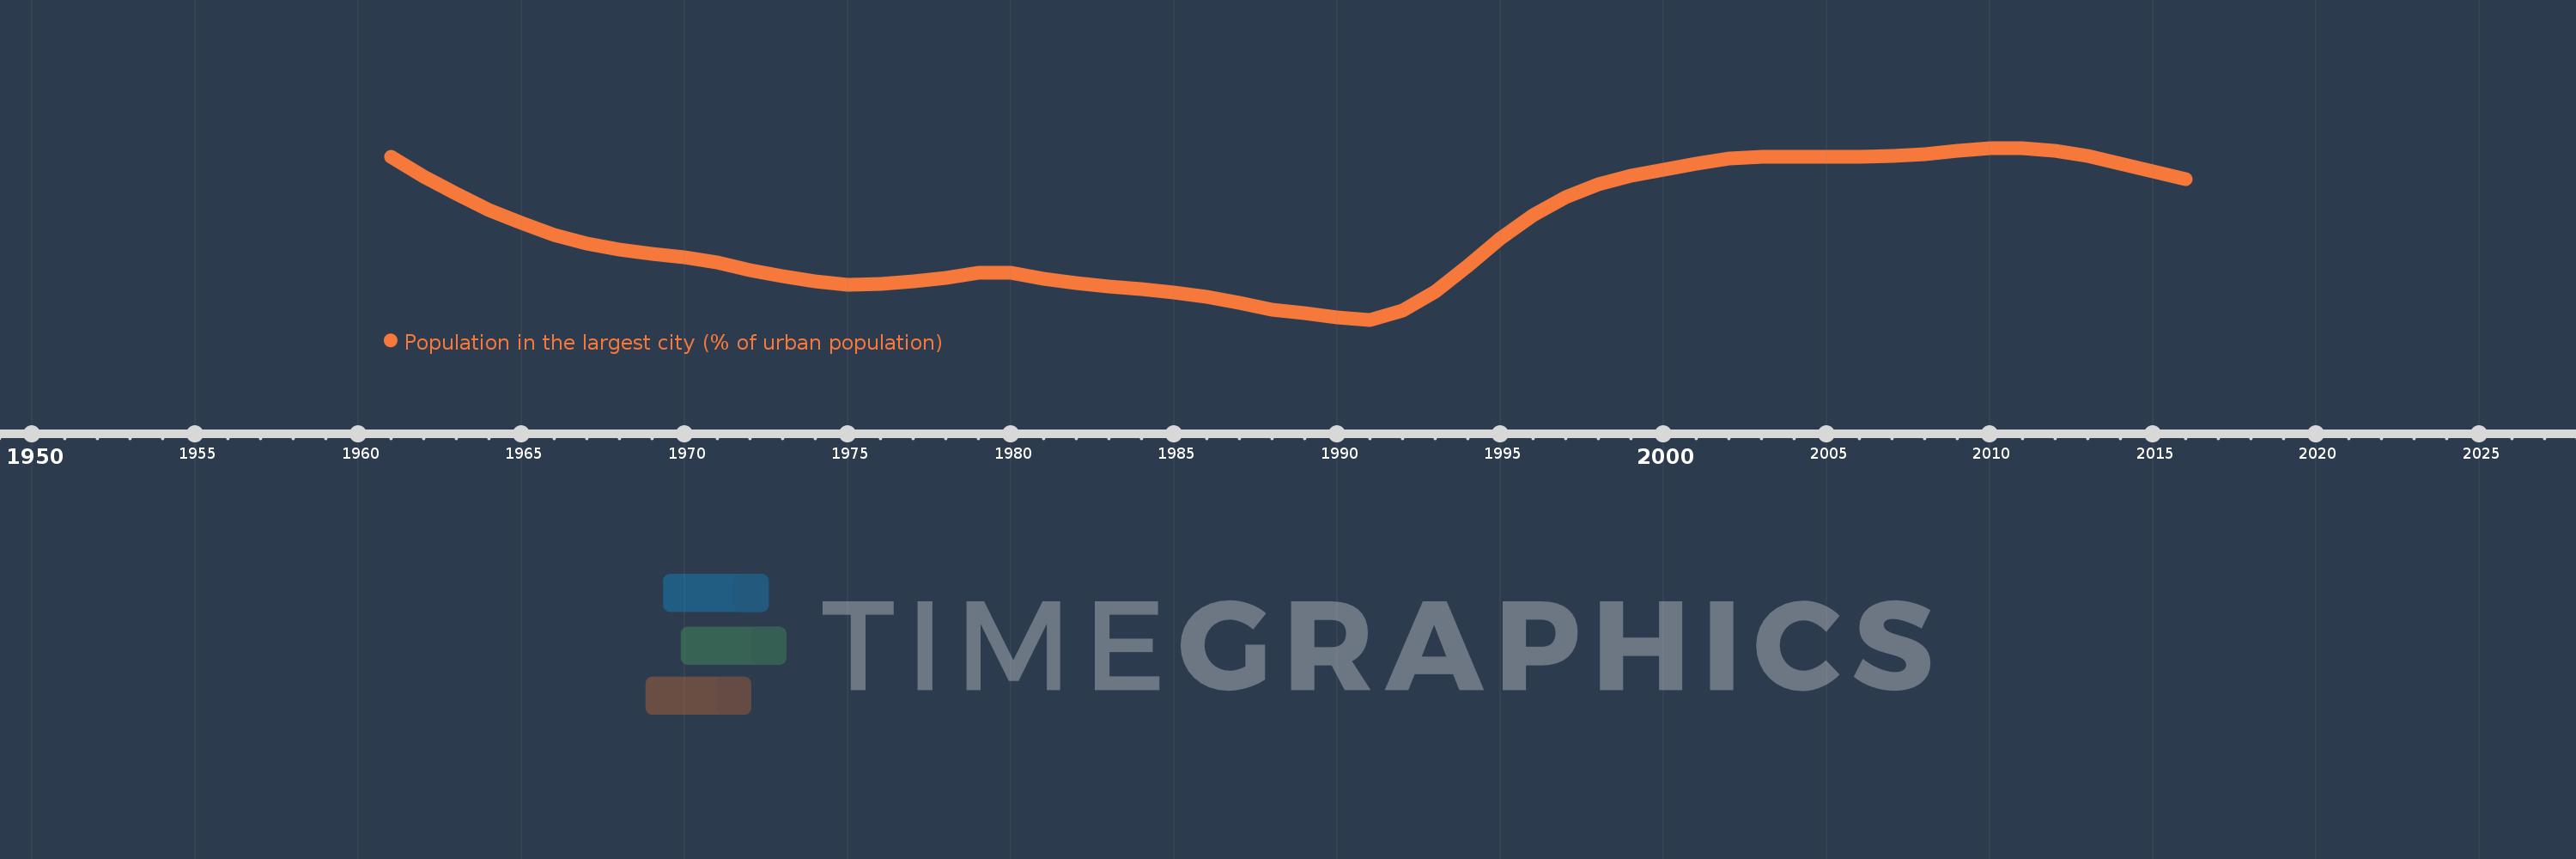
Population in the largest city (% of urban population)
2016,2015,2014,2013,2012,2011,2010,2009,2008,2007,2006,2005,2004,2003,2002,2001,2000,1999,1998,1997,1996,1995,1994,1993,1992,1991,1990,1989,1988,1987,1986,1985,1984,1983,1982,1981,1980,1979,1978,1977,1976,1975,1974,1973,1972,1971,1970,1969,1968,1967,1966,1965,1964,1963,1962,1961
This statistics in other country:
AfghanistanAlbaniaAlgeriaAngolaArab WorldArgentinaArmeniaAustraliaAustriaAzerbaijanBahrainBangladeshBelarusBelgiumBeninBoliviaBosnia and HerzegovinaBrazilBulgariaBurkina FasoBurundiCambodiaCameroonCanadaCentral African RepublicCentral Europe and the BalticsChadChileChinaColombiaCongo, Dem. Rep.Congo, Rep.Costa RicaCote d'IvoireCroatiaCubaCzech RepublicDenmarkDjiboutiDominican RepublicEarly-demographic dividendEast Asia & PacificEast Asia & Pacific (excluding high income)East Asia & Pacific (IDA & IBRD countries)EcuadorEgypt, Arab Rep.El SalvadorEritreaEstoniaEthiopiaEuro areaEurope & Central AsiaEurope & Central Asia (excluding high income)Europe & Central Asia (IDA & IBRD countries)European UnionFinlandFragile and conflict affected situationsFranceGabonGambia, TheGeorgiaGermanyGhanaGreeceGuatemalaGuineaGuinea-BissauHaitiHeavily indebted poor countries (HIPC)High incomeHondurasHong Kong SAR, ChinaHungaryIBRD onlyIDA & IBRD totalIDA blendIDA onlyIDA totalIndiaIndonesiaIran, Islamic Rep.IraqIrelandIsraelItalyJamaicaJapanJordanKazakhstanKenyaKorea, Dem. People’s Rep.Korea, Rep.KuwaitKyrgyz RepublicLao PDRLate-demographic dividendLatin America & Caribbean Latin America & Caribbean (excluding high income)Latin America & the Caribbean (IDA & IBRD countries)LatviaLeast developed countries: UN classificationLebanonLiberiaLibyaLithuaniaLow & middle incomeLow incomeLower middle incomeMacao SAR, ChinaMacedonia, FYRMadagascarMalawiMalaysiaMaliMauritaniaMexicoMiddle East & North AfricaMiddle East & North Africa (excluding high income)Middle East & North Africa (IDA & IBRD countries)Middle incomeMoldovaMongoliaMoroccoMozambiqueMyanmarNamibiaNepalNetherlandsNew ZealandNicaraguaNigerNigeriaNorth AmericaNorwayOECD membersOmanPakistanPanamaPapua New GuineaParaguayPeruPhilippinesPolandPortugalPost-demographic dividendPre-demographic dividendPuerto RicoQatarRomaniaRussian FederationRwandaSaudi ArabiaSenegalSerbiaSierra LeoneSingaporeSlovak RepublicSomaliaSouth AfricaSouth AsiaSouth Asia (IDA & IBRD)South SudanSpainSri LankaSub-Saharan Africa Sub-Saharan Africa (excluding high income)Sub-Saharan Africa (IDA & IBRD countries)SudanSwedenSwitzerlandSyrian Arab RepublicTajikistanTanzaniaThailandTogoTunisiaTurkeyTurkmenistanUgandaUkraineUnited Arab EmiratesUnited KingdomUnited StatesUpper middle incomeUruguayUzbekistanVenezuela, RBVietnamWest Bank and GazaWorldYemen, Rep.ZambiaZimbabwe Timeline:
This timeline shows a graph from 1961 to 2016 of Armenia. No data until 1960. Number of actual observations by date: 56.
Source name:
World Development Indicators
Source organization:
United Nations, World Urbanization Prospects.
Categories, topics:
Urban Development
Last updated:
apr 23, 2017
Indicators value changes by year
Minimum:
49.146
jan 1, 1991
Maximum:
56.555
jan 1, 2011
At the date of observation
Value
Absolute change
Change from previous value
jan 1, 1961
56.162
+56.162
0.0%
jan 1, 1962
55.333
-0.829
-1.48%
jan 1, 1963
54.57
-0.763
-1.38%
jan 1, 1964
53.888
-0.682
-1.25%
jan 1, 1965
53.303
-0.585
-1.09%
jan 1, 1966
52.819
-0.484
-0.91%
jan 1, 1967
52.444
-0.375
-0.71%
jan 1, 1968
52.167
-0.278
-0.53%
jan 1, 1969
51.971
-0.196
-0.37%
jan 1, 1970
51.829
-0.142
-0.27%
jan 1, 1971
51.615
-0.214
-0.41%
jan 1, 1972
51.301
-0.314
-0.61%
jan 1, 1973
51.032
-0.269
-0.52%
jan 1, 1974
50.812
-0.22
-0.43%
jan 1, 1975
50.656
-0.156
-0.31%
jan 1, 1976
50.694
+0.038
0.08%
jan 1, 1977
50.799
+0.105
0.21%
jan 1, 1978
50.961
+0.162
0.32%
jan 1, 1979
51.177
+0.217
0.43%
jan 1, 1980
51.186
+0.009
0.02%
jan 1, 1981
50.931
-0.255
-0.5%
jan 1, 1982
50.725
-0.205
-0.4%
jan 1, 1983
50.577
-0.149
-0.29%
jan 1, 1984
50.45
-0.126
-0.25%
jan 1, 1985
50.305
-0.146
-0.29%
jan 1, 1986
50.122
-0.183
-0.36%
jan 1, 1987
49.868
-0.254
-0.51%
jan 1, 1988
49.585
-0.283
-0.57%
jan 1, 1989
49.422
-0.164
-0.33%
jan 1, 1990
49.25
-0.172
-0.35%
jan 1, 1991
49.146
-0.104
-0.21%
jan 1, 1992
49.53
+0.384
0.78%
jan 1, 1993
50.352
+0.822
1.66%
jan 1, 1994
51.47
+1.118
2.22%
jan 1, 1995
52.643
+1.173
2.28%
jan 1, 1996
53.659
+1.017
1.93%
jan 1, 1997
54.427
+0.767
1.43%
jan 1, 1998
54.976
+0.549
1.01%
jan 1, 1999
55.341
+0.365
0.66%
jan 1, 2000
55.614
+0.273
0.49%
jan 1, 2001
55.867
+0.253
0.46%
jan 1, 2002
56.095
+0.228
0.41%
jan 1, 2003
56.17
+0.075
0.13%
jan 1, 2004
56.174
+0.004
0.01%
jan 1, 2005
56.171
-0.003
-0.01%
jan 1, 2006
56.181
+0.01
0.02%
jan 1, 2007
56.224
+0.043
0.08%
jan 1, 2008
56.291
+0.067
0.12%
jan 1, 2009
56.418
+0.127
0.23%
jan 1, 2010
56.546
+0.127
0.23%
jan 1, 2011
56.555
+0.009
0.02%
jan 1, 2012
56.429
-0.126
-0.22%
jan 1, 2013
56.194
-0.235
-0.42%
jan 1, 2014
55.874
-0.32
-0.57%
jan 1, 2015
55.536
-0.338
-0.61%
jan 1, 2016
55.224
-0.312
-0.56%
Ranking of countries by current statistics by years


Comments: