29
/
en
AIzaSyAYiBZKx7MnpbEhh9jyipgxe19OcubqV5w
April 1, 2024
123997
Ecuador
ECU
true
2
1
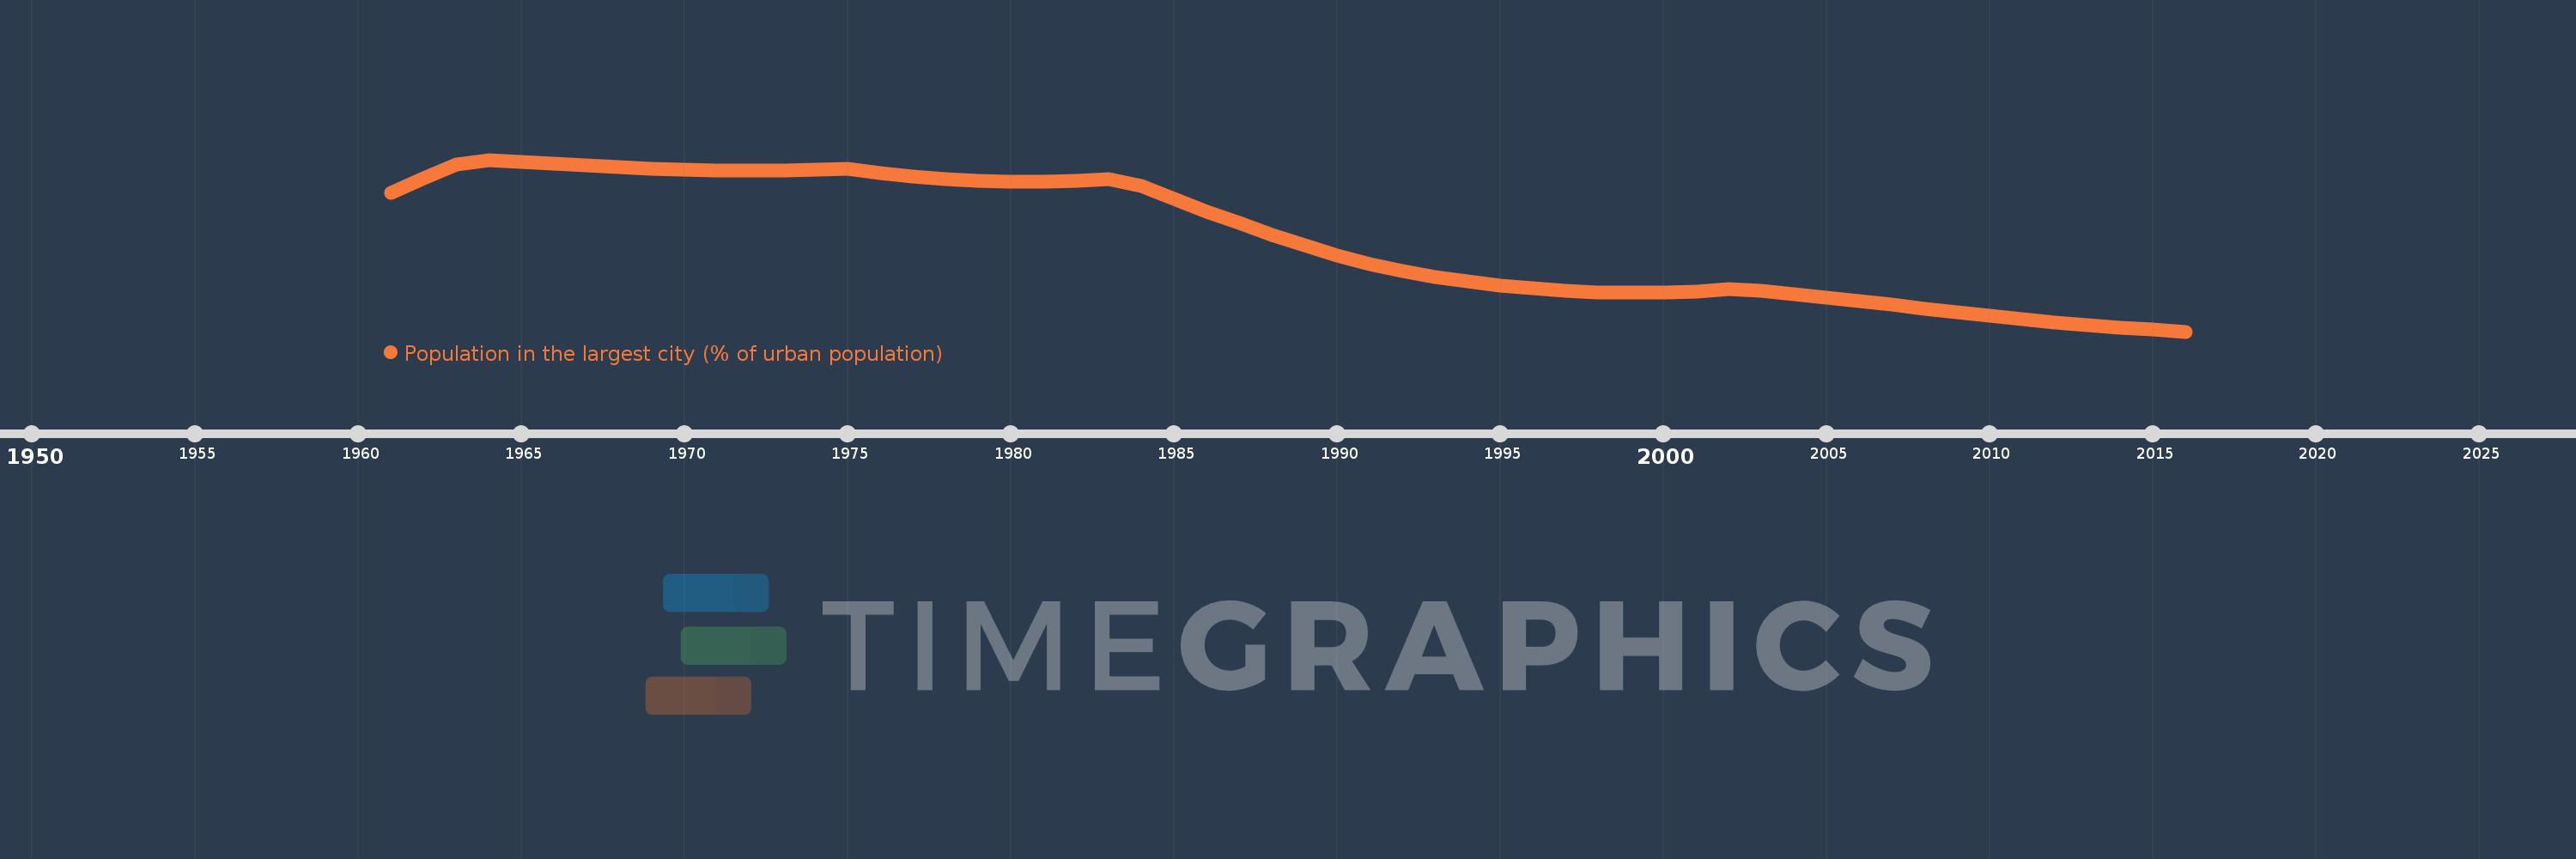
Population in the largest city (% of urban population)
2016,2015,2014,2013,2012,2011,2010,2009,2008,2007,2006,2005,2004,2003,2002,2001,2000,1999,1998,1997,1996,1995,1994,1993,1992,1991,1990,1989,1988,1987,1986,1985,1984,1983,1982,1981,1980,1979,1978,1977,1976,1975,1974,1973,1972,1971,1970,1969,1968,1967,1966,1965,1964,1963,1962,1961
This statistics in other country:
AfghanistanAlbaniaAlgeriaAngolaArab WorldArgentinaArmeniaAustraliaAustriaAzerbaijanBahrainBangladeshBelarusBelgiumBeninBoliviaBosnia and HerzegovinaBrazilBulgariaBurkina FasoBurundiCambodiaCameroonCanadaCentral African RepublicCentral Europe and the BalticsChadChileChinaColombiaCongo, Dem. Rep.Congo, Rep.Costa RicaCote d'IvoireCroatiaCubaCzech RepublicDenmarkDjiboutiDominican RepublicEarly-demographic dividendEast Asia & PacificEast Asia & Pacific (excluding high income)East Asia & Pacific (IDA & IBRD countries)EcuadorEgypt, Arab Rep.El SalvadorEritreaEstoniaEthiopiaEuro areaEurope & Central AsiaEurope & Central Asia (excluding high income)Europe & Central Asia (IDA & IBRD countries)European UnionFinlandFragile and conflict affected situationsFranceGabonGambia, TheGeorgiaGermanyGhanaGreeceGuatemalaGuineaGuinea-BissauHaitiHeavily indebted poor countries (HIPC)High incomeHondurasHong Kong SAR, ChinaHungaryIBRD onlyIDA & IBRD totalIDA blendIDA onlyIDA totalIndiaIndonesiaIran, Islamic Rep.IraqIrelandIsraelItalyJamaicaJapanJordanKazakhstanKenyaKorea, Dem. People’s Rep.Korea, Rep.KuwaitKyrgyz RepublicLao PDRLate-demographic dividendLatin America & Caribbean Latin America & Caribbean (excluding high income)Latin America & the Caribbean (IDA & IBRD countries)LatviaLeast developed countries: UN classificationLebanonLiberiaLibyaLithuaniaLow & middle incomeLow incomeLower middle incomeMacao SAR, ChinaMacedonia, FYRMadagascarMalawiMalaysiaMaliMauritaniaMexicoMiddle East & North AfricaMiddle East & North Africa (excluding high income)Middle East & North Africa (IDA & IBRD countries)Middle incomeMoldovaMongoliaMoroccoMozambiqueMyanmarNamibiaNepalNetherlandsNew ZealandNicaraguaNigerNigeriaNorth AmericaNorwayOECD membersOmanPakistanPanamaPapua New GuineaParaguayPeruPhilippinesPolandPortugalPost-demographic dividendPre-demographic dividendPuerto RicoQatarRomaniaRussian FederationRwandaSaudi ArabiaSenegalSerbiaSierra LeoneSingaporeSlovak RepublicSomaliaSouth AfricaSouth AsiaSouth Asia (IDA & IBRD)South SudanSpainSri LankaSub-Saharan Africa Sub-Saharan Africa (excluding high income)Sub-Saharan Africa (IDA & IBRD countries)SudanSwedenSwitzerlandSyrian Arab RepublicTajikistanTanzaniaThailandTogoTunisiaTurkeyTurkmenistanUgandaUkraineUnited Arab EmiratesUnited KingdomUnited StatesUpper middle incomeUruguayUzbekistanVenezuela, RBVietnamWest Bank and GazaWorldYemen, Rep.ZambiaZimbabwe Timeline:
This timeline shows a graph from 1961 to 2016 of Ecuador. No data until 1960. Number of actual observations by date: 56.
Source name:
World Development Indicators
Source organization:
United Nations, World Urbanization Prospects.
Categories, topics:
Urban Development
Last updated:
apr 23, 2017
Indicators value changes by year
Minimum:
26.328
jan 1, 2016
Maximum:
30.401
jan 1, 1964
At the date of observation
Value
Absolute change
Change from previous value
jan 1, 1961
29.626
+29.626
0.0%
jan 1, 1962
29.956
+0.33
1.11%
jan 1, 1963
30.29
+0.334
1.12%
jan 1, 1964
30.401
+0.11
0.36%
jan 1, 1965
30.358
-0.043
-0.14%
jan 1, 1966
30.312
-0.046
-0.15%
jan 1, 1967
30.269
-0.044
-0.14%
jan 1, 1968
30.228
-0.04
-0.13%
jan 1, 1969
30.193
-0.035
-0.12%
jan 1, 1970
30.165
-0.029
-0.09%
jan 1, 1971
30.146
-0.019
-0.06%
jan 1, 1972
30.139
-0.007
-0.02%
jan 1, 1973
30.143
+0.004
0.01%
jan 1, 1974
30.157
+0.014
0.05%
jan 1, 1975
30.177
+0.02
0.06%
jan 1, 1976
30.079
-0.098
-0.32%
jan 1, 1977
30.002
-0.077
-0.25%
jan 1, 1978
29.944
-0.058
-0.19%
jan 1, 1979
29.907
-0.037
-0.12%
jan 1, 1980
29.889
-0.018
-0.06%
jan 1, 1981
29.891
+0.002
0.01%
jan 1, 1982
29.91
+0.019
0.06%
jan 1, 1983
29.948
+0.038
0.13%
jan 1, 1984
29.781
-0.167
-0.56%
jan 1, 1985
29.474
-0.307
-1.03%
jan 1, 1986
29.179
-0.295
-1.0%
jan 1, 1987
28.896
-0.282
-0.97%
jan 1, 1988
28.628
-0.268
-0.93%
jan 1, 1989
28.375
-0.253
-0.88%
jan 1, 1990
28.138
-0.237
-0.84%
jan 1, 1991
27.919
-0.219
-0.78%
jan 1, 1992
27.754
-0.165
-0.59%
jan 1, 1993
27.629
-0.125
-0.45%
jan 1, 1994
27.519
-0.111
-0.4%
jan 1, 1995
27.426
-0.092
-0.34%
jan 1, 1996
27.353
-0.073
-0.27%
jan 1, 1997
27.299
-0.054
-0.2%
jan 1, 1998
27.262
-0.038
-0.14%
jan 1, 1999
27.245
-0.016
-0.06%
jan 1, 2000
27.251
+0.006
0.02%
jan 1, 2001
27.28
+0.03
0.11%
jan 1, 2002
27.333
+0.052
0.19%
jan 1, 2003
27.305
-0.028
-0.1%
jan 1, 2004
27.221
-0.084
-0.31%
jan 1, 2005
27.14
-0.081
-0.3%
jan 1, 2006
27.055
-0.085
-0.31%
jan 1, 2007
26.966
-0.089
-0.33%
jan 1, 2008
26.874
-0.092
-0.34%
jan 1, 2009
26.783
-0.091
-0.34%
jan 1, 2010
26.697
-0.086
-0.32%
jan 1, 2011
26.62
-0.077
-0.29%
jan 1, 2012
26.552
-0.068
-0.26%
jan 1, 2013
26.488
-0.064
-0.24%
jan 1, 2014
26.429
-0.059
-0.22%
jan 1, 2015
26.373
-0.055
-0.21%
jan 1, 2016
26.328
-0.045
-0.17%
Ranking of countries by current statistics by years


Comments: