29
/
en
AIzaSyAYiBZKx7MnpbEhh9jyipgxe19OcubqV5w
April 1, 2024
36913
IBRD only
IBD
false
2
1
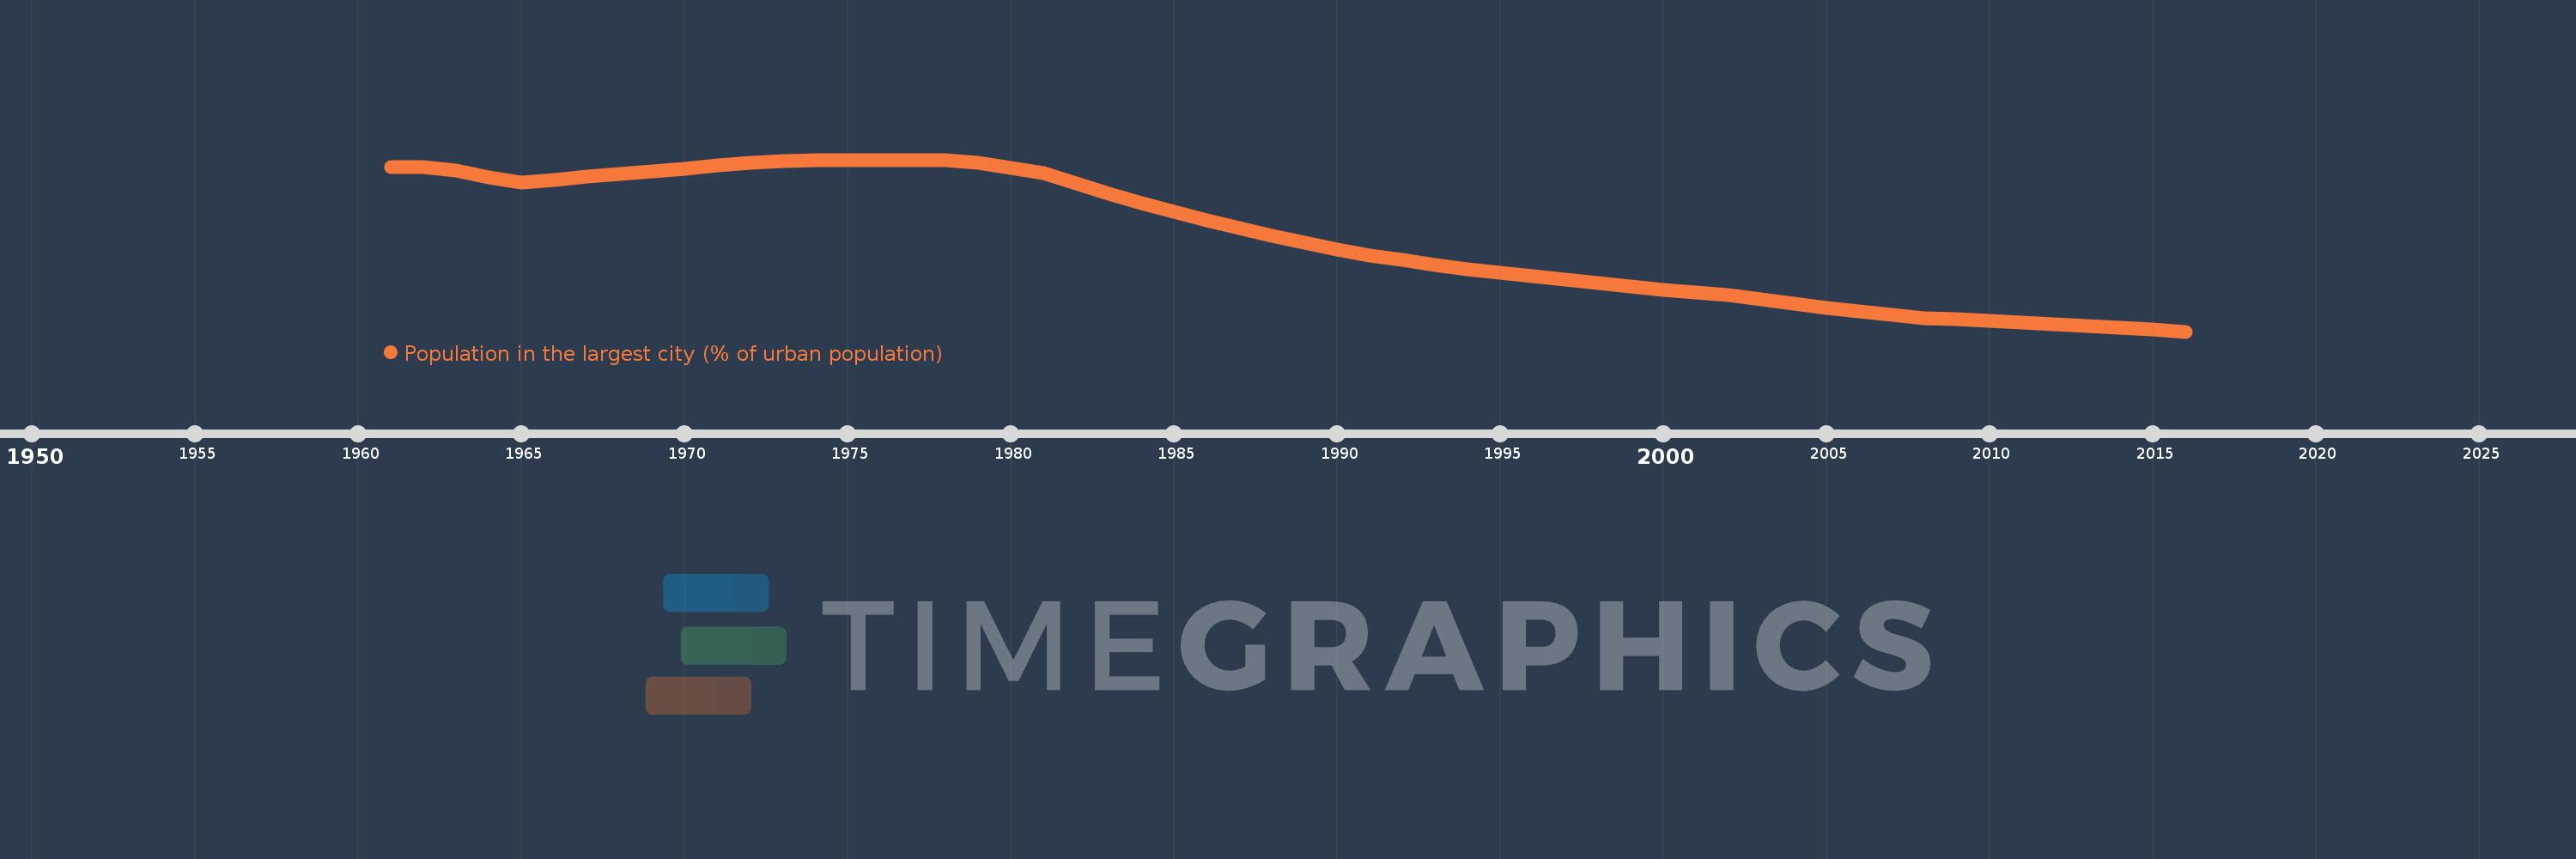
Population in the largest city (% of urban population)
2016,2015,2014,2013,2012,2011,2010,2009,2008,2007,2006,2005,2004,2003,2002,2001,2000,1999,1998,1997,1996,1995,1994,1993,1992,1991,1990,1989,1988,1987,1986,1985,1984,1983,1982,1981,1980,1979,1978,1977,1976,1975,1974,1973,1972,1971,1970,1969,1968,1967,1966,1965,1964,1963,1962,1961
This statistics in other country:
AfghanistanAlbaniaAlgeriaAngolaArab WorldArgentinaArmeniaAustraliaAustriaAzerbaijanBahrainBangladeshBelarusBelgiumBeninBoliviaBosnia and HerzegovinaBrazilBulgariaBurkina FasoBurundiCambodiaCameroonCanadaCentral African RepublicCentral Europe and the BalticsChadChileChinaColombiaCongo, Dem. Rep.Congo, Rep.Costa RicaCote d'IvoireCroatiaCubaCzech RepublicDenmarkDjiboutiDominican RepublicEarly-demographic dividendEast Asia & PacificEast Asia & Pacific (excluding high income)East Asia & Pacific (IDA & IBRD countries)EcuadorEgypt, Arab Rep.El SalvadorEritreaEstoniaEthiopiaEuro areaEurope & Central AsiaEurope & Central Asia (excluding high income)Europe & Central Asia (IDA & IBRD countries)European UnionFinlandFragile and conflict affected situationsFranceGabonGambia, TheGeorgiaGermanyGhanaGreeceGuatemalaGuineaGuinea-BissauHaitiHeavily indebted poor countries (HIPC)High incomeHondurasHong Kong SAR, ChinaHungaryIBRD onlyIDA & IBRD totalIDA blendIDA onlyIDA totalIndiaIndonesiaIran, Islamic Rep.IraqIrelandIsraelItalyJamaicaJapanJordanKazakhstanKenyaKorea, Dem. People’s Rep.Korea, Rep.KuwaitKyrgyz RepublicLao PDRLate-demographic dividendLatin America & Caribbean Latin America & Caribbean (excluding high income)Latin America & the Caribbean (IDA & IBRD countries)LatviaLeast developed countries: UN classificationLebanonLiberiaLibyaLithuaniaLow & middle incomeLow incomeLower middle incomeMacao SAR, ChinaMacedonia, FYRMadagascarMalawiMalaysiaMaliMauritaniaMexicoMiddle East & North AfricaMiddle East & North Africa (excluding high income)Middle East & North Africa (IDA & IBRD countries)Middle incomeMoldovaMongoliaMoroccoMozambiqueMyanmarNamibiaNepalNetherlandsNew ZealandNicaraguaNigerNigeriaNorth AmericaNorwayOECD membersOmanPakistanPanamaPapua New GuineaParaguayPeruPhilippinesPolandPortugalPost-demographic dividendPre-demographic dividendPuerto RicoQatarRomaniaRussian FederationRwandaSaudi ArabiaSenegalSerbiaSierra LeoneSingaporeSlovak RepublicSomaliaSouth AfricaSouth AsiaSouth Asia (IDA & IBRD)South SudanSpainSri LankaSub-Saharan Africa Sub-Saharan Africa (excluding high income)Sub-Saharan Africa (IDA & IBRD countries)SudanSwedenSwitzerlandSyrian Arab RepublicTajikistanTanzaniaThailandTogoTunisiaTurkeyTurkmenistanUgandaUkraineUnited Arab EmiratesUnited KingdomUnited StatesUpper middle incomeUruguayUzbekistanVenezuela, RBVietnamWest Bank and GazaWorldYemen, Rep.ZambiaZimbabwe Timeline:
This timeline shows a graph from 1961 to 2016 of IBRD only. No data until 1960. Number of actual observations by date: 56.
Source name:
World Development Indicators
Source organization:
United Nations, World Urbanization Prospects.
Categories, topics:
Urban Development
Last updated:
apr 23, 2017
Indicators value changes by year
Minimum:
12.422
jan 1, 2016
Maximum:
15.707
jan 1, 1976
At the date of observation
Value
Absolute change
Change from previous value
jan 1, 1961
15.561
+15.561
0.0%
jan 1, 1962
15.568
+0.007
0.04%
jan 1, 1963
15.497
-0.071
-0.45%
jan 1, 1964
15.374
-0.123
-0.79%
jan 1, 1965
15.267
-0.107
-0.7%
jan 1, 1966
15.326
+0.059
0.39%
jan 1, 1967
15.385
+0.059
0.38%
jan 1, 1968
15.431
+0.045
0.29%
jan 1, 1969
15.484
+0.053
0.34%
jan 1, 1970
15.541
+0.058
0.37%
jan 1, 1971
15.605
+0.063
0.41%
jan 1, 1972
15.646
+0.041
0.26%
jan 1, 1973
15.678
+0.033
0.21%
jan 1, 1974
15.696
+0.017
0.11%
jan 1, 1975
15.695
-0.001
0.0%
jan 1, 1976
15.707
+0.012
0.08%
jan 1, 1977
15.705
-0.001
-0.01%
jan 1, 1978
15.701
-0.005
-0.03%
jan 1, 1979
15.657
-0.044
-0.28%
jan 1, 1980
15.556
-0.101
-0.64%
jan 1, 1981
15.449
-0.107
-0.69%
jan 1, 1982
15.263
-0.186
-1.2%
jan 1, 1983
15.057
-0.205
-1.34%
jan 1, 1984
14.874
-0.184
-1.22%
jan 1, 1985
14.708
-0.165
-1.11%
jan 1, 1986
14.55
-0.159
-1.08%
jan 1, 1987
14.396
-0.154
-1.06%
jan 1, 1988
14.249
-0.147
-1.02%
jan 1, 1989
14.117
-0.132
-0.93%
jan 1, 1990
13.991
-0.126
-0.89%
jan 1, 1991
13.883
-0.109
-0.78%
jan 1, 1992
13.787
-0.096
-0.69%
jan 1, 1993
13.699
-0.088
-0.64%
jan 1, 1994
13.616
-0.084
-0.61%
jan 1, 1995
13.542
-0.073
-0.54%
jan 1, 1996
13.478
-0.064
-0.47%
jan 1, 1997
13.413
-0.065
-0.49%
jan 1, 1998
13.344
-0.069
-0.51%
jan 1, 1999
13.278
-0.066
-0.49%
jan 1, 2000
13.22
-0.058
-0.44%
jan 1, 2001
13.174
-0.046
-0.35%
jan 1, 2002
13.112
-0.062
-0.47%
jan 1, 2003
13.034
-0.078
-0.59%
jan 1, 2004
12.959
-0.075
-0.58%
jan 1, 2005
12.878
-0.082
-0.63%
jan 1, 2006
12.802
-0.075
-0.59%
jan 1, 2007
12.739
-0.064
-0.5%
jan 1, 2008
12.684
-0.055
-0.43%
jan 1, 2009
12.663
-0.021
-0.16%
jan 1, 2010
12.625
-0.038
-0.3%
jan 1, 2011
12.592
-0.033
-0.26%
jan 1, 2012
12.559
-0.033
-0.26%
jan 1, 2013
12.524
-0.034
-0.27%
jan 1, 2014
12.494
-0.03
-0.24%
jan 1, 2015
12.471
-0.023
-0.18%
jan 1, 2016
12.422
-0.049
-0.39%
Ranking of countries by current statistics by years


Comments: