29
/
en
AIzaSyAYiBZKx7MnpbEhh9jyipgxe19OcubqV5w
April 1, 2024
26823
Early-demographic dividend
EAR
false
2
1
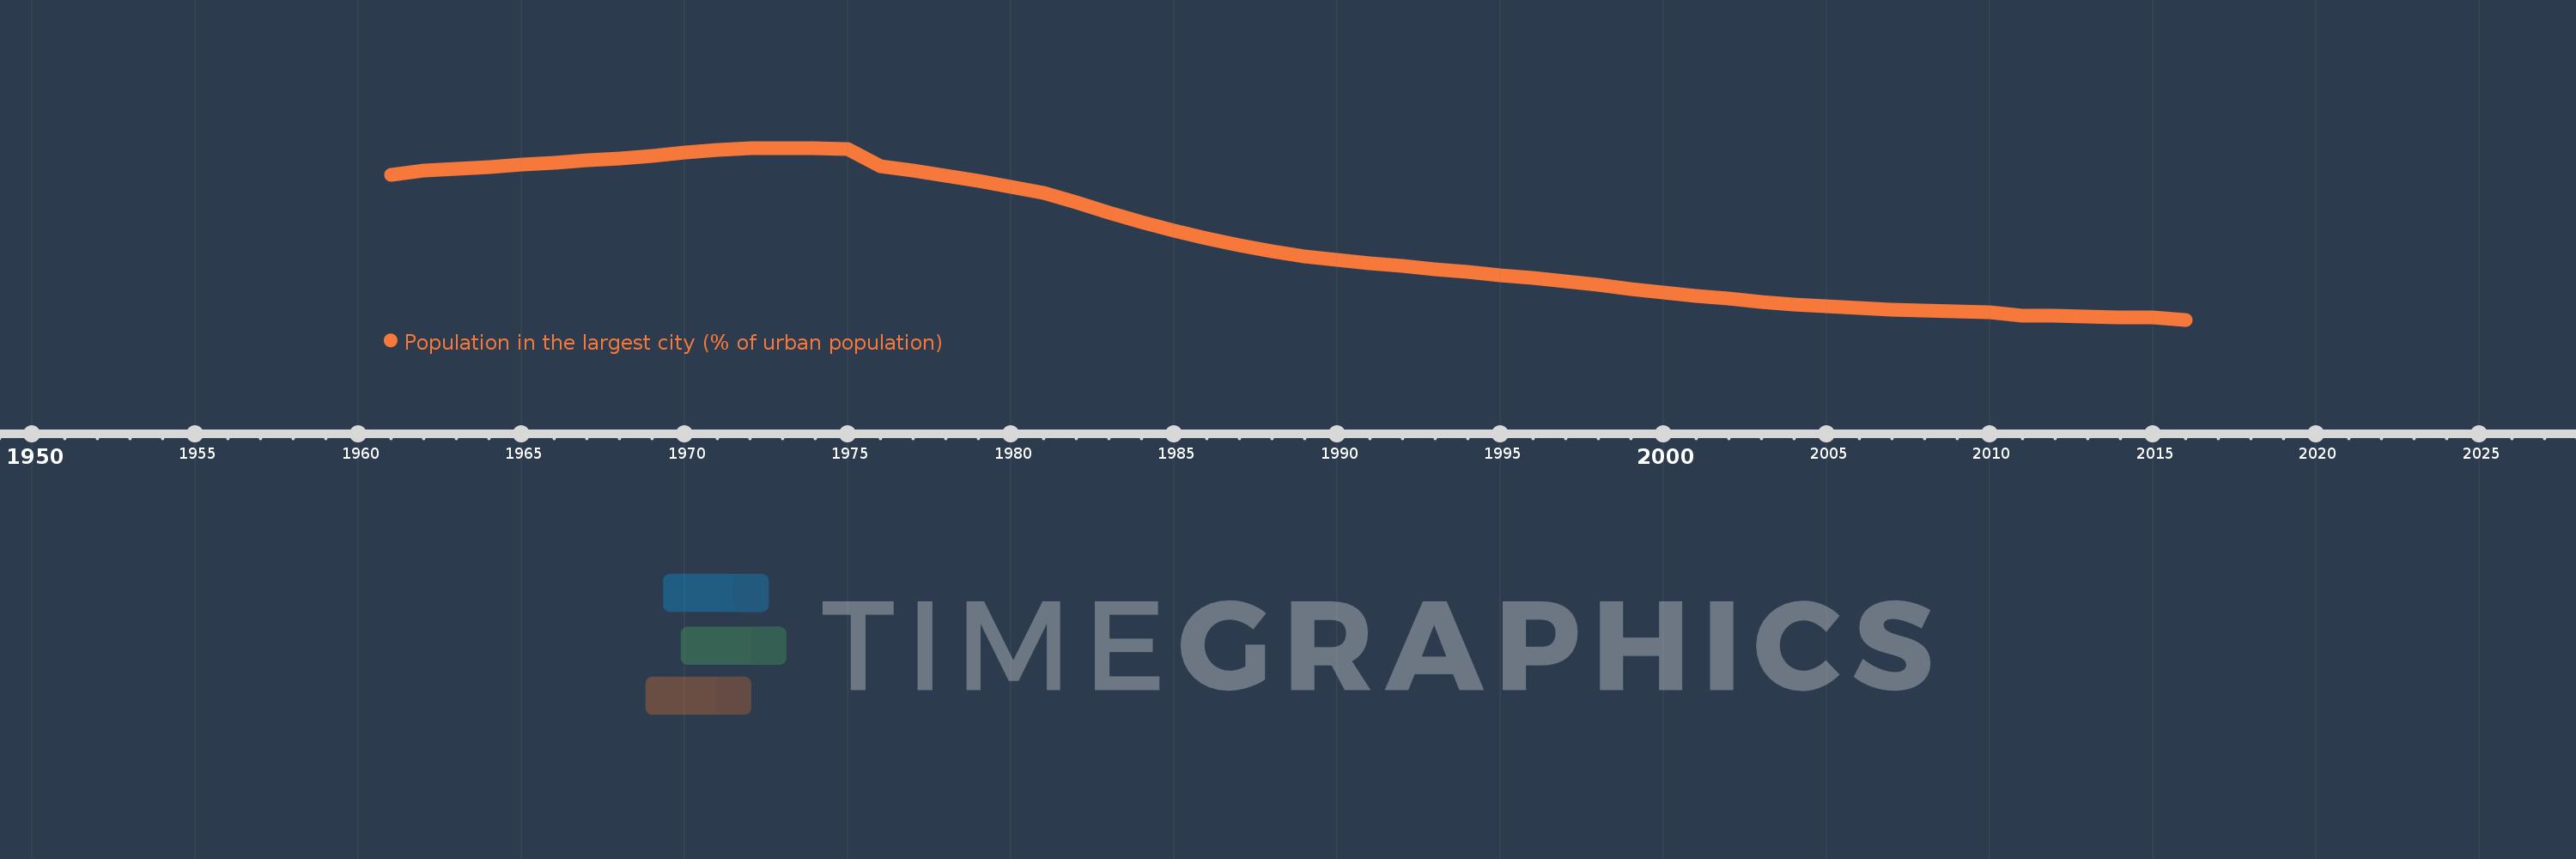
Population in the largest city (% of urban population)
2016,2015,2014,2013,2012,2011,2010,2009,2008,2007,2006,2005,2004,2003,2002,2001,2000,1999,1998,1997,1996,1995,1994,1993,1992,1991,1990,1989,1988,1987,1986,1985,1984,1983,1982,1981,1980,1979,1978,1977,1976,1975,1974,1973,1972,1971,1970,1969,1968,1967,1966,1965,1964,1963,1962,1961
This statistics in other country:
AfghanistanAlbaniaAlgeriaAngolaArab WorldArgentinaArmeniaAustraliaAustriaAzerbaijanBahrainBangladeshBelarusBelgiumBeninBoliviaBosnia and HerzegovinaBrazilBulgariaBurkina FasoBurundiCambodiaCameroonCanadaCentral African RepublicCentral Europe and the BalticsChadChileChinaColombiaCongo, Dem. Rep.Congo, Rep.Costa RicaCote d'IvoireCroatiaCubaCzech RepublicDenmarkDjiboutiDominican RepublicEarly-demographic dividendEast Asia & PacificEast Asia & Pacific (excluding high income)East Asia & Pacific (IDA & IBRD countries)EcuadorEgypt, Arab Rep.El SalvadorEritreaEstoniaEthiopiaEuro areaEurope & Central AsiaEurope & Central Asia (excluding high income)Europe & Central Asia (IDA & IBRD countries)European UnionFinlandFragile and conflict affected situationsFranceGabonGambia, TheGeorgiaGermanyGhanaGreeceGuatemalaGuineaGuinea-BissauHaitiHeavily indebted poor countries (HIPC)High incomeHondurasHong Kong SAR, ChinaHungaryIBRD onlyIDA & IBRD totalIDA blendIDA onlyIDA totalIndiaIndonesiaIran, Islamic Rep.IraqIrelandIsraelItalyJamaicaJapanJordanKazakhstanKenyaKorea, Dem. People’s Rep.Korea, Rep.KuwaitKyrgyz RepublicLao PDRLate-demographic dividendLatin America & Caribbean Latin America & Caribbean (excluding high income)Latin America & the Caribbean (IDA & IBRD countries)LatviaLeast developed countries: UN classificationLebanonLiberiaLibyaLithuaniaLow & middle incomeLow incomeLower middle incomeMacao SAR, ChinaMacedonia, FYRMadagascarMalawiMalaysiaMaliMauritaniaMexicoMiddle East & North AfricaMiddle East & North Africa (excluding high income)Middle East & North Africa (IDA & IBRD countries)Middle incomeMoldovaMongoliaMoroccoMozambiqueMyanmarNamibiaNepalNetherlandsNew ZealandNicaraguaNigerNigeriaNorth AmericaNorwayOECD membersOmanPakistanPanamaPapua New GuineaParaguayPeruPhilippinesPolandPortugalPost-demographic dividendPre-demographic dividendPuerto RicoQatarRomaniaRussian FederationRwandaSaudi ArabiaSenegalSerbiaSierra LeoneSingaporeSlovak RepublicSomaliaSouth AfricaSouth AsiaSouth Asia (IDA & IBRD)South SudanSpainSri LankaSub-Saharan Africa Sub-Saharan Africa (excluding high income)Sub-Saharan Africa (IDA & IBRD countries)SudanSwedenSwitzerlandSyrian Arab RepublicTajikistanTanzaniaThailandTogoTunisiaTurkeyTurkmenistanUgandaUkraineUnited Arab EmiratesUnited KingdomUnited StatesUpper middle incomeUruguayUzbekistanVenezuela, RBVietnamWest Bank and GazaWorldYemen, Rep.ZambiaZimbabwe Timeline:
This timeline shows a graph from 1961 to 2016 of Early-demographic dividend. No data until 1960. Number of actual observations by date: 56.
Source name:
World Development Indicators
Source organization:
United Nations, World Urbanization Prospects.
Categories, topics:
Urban Development
Last updated:
apr 23, 2017
Indicators value changes by year
Minimum:
18.099
jan 1, 2016
Maximum:
22.239
jan 1, 1973
At the date of observation
Value
Absolute change
Change from previous value
jan 1, 1961
21.594
+21.594
0.0%
jan 1, 1962
21.691
+0.097
0.45%
jan 1, 1963
21.738
+0.047
0.22%
jan 1, 1964
21.783
+0.044
0.2%
jan 1, 1965
21.833
+0.051
0.23%
jan 1, 1966
21.889
+0.056
0.26%
jan 1, 1967
21.949
+0.06
0.27%
jan 1, 1968
21.994
+0.045
0.2%
jan 1, 1969
22.056
+0.062
0.28%
jan 1, 1970
22.125
+0.068
0.31%
jan 1, 1971
22.192
+0.067
0.3%
jan 1, 1972
22.234
+0.042
0.19%
jan 1, 1973
22.239
+0.005
0.02%
jan 1, 1974
22.231
-0.008
-0.04%
jan 1, 1975
22.219
-0.011
-0.05%
jan 1, 1976
21.805
-0.414
-1.87%
jan 1, 1977
21.699
-0.106
-0.49%
jan 1, 1978
21.576
-0.123
-0.57%
jan 1, 1979
21.436
-0.14
-0.65%
jan 1, 1980
21.294
-0.142
-0.66%
jan 1, 1981
21.159
-0.135
-0.64%
jan 1, 1982
20.929
-0.23
-1.08%
jan 1, 1983
20.679
-0.25
-1.19%
jan 1, 1984
20.449
-0.231
-1.12%
jan 1, 1985
20.248
-0.201
-0.98%
jan 1, 1986
20.059
-0.189
-0.93%
jan 1, 1987
19.89
-0.169
-0.84%
jan 1, 1988
19.747
-0.143
-0.72%
jan 1, 1989
19.631
-0.116
-0.59%
jan 1, 1990
19.533
-0.098
-0.5%
jan 1, 1991
19.461
-0.072
-0.37%
jan 1, 1992
19.393
-0.068
-0.35%
jan 1, 1993
19.321
-0.072
-0.37%
jan 1, 1994
19.245
-0.077
-0.4%
jan 1, 1995
19.177
-0.068
-0.35%
jan 1, 1996
19.117
-0.06
-0.31%
jan 1, 1997
19.034
-0.083
-0.43%
jan 1, 1998
18.94
-0.094
-0.49%
jan 1, 1999
18.843
-0.097
-0.51%
jan 1, 2000
18.749
-0.094
-0.5%
jan 1, 2001
18.666
-0.083
-0.44%
jan 1, 2002
18.61
-0.056
-0.3%
jan 1, 2003
18.535
-0.076
-0.41%
jan 1, 2004
18.474
-0.061
-0.33%
jan 1, 2005
18.425
-0.049
-0.26%
jan 1, 2006
18.385
-0.041
-0.22%
jan 1, 2007
18.35
-0.034
-0.19%
jan 1, 2008
18.32
-0.031
-0.17%
jan 1, 2009
18.292
-0.028
-0.15%
jan 1, 2010
18.269
-0.023
-0.12%
jan 1, 2011
18.201
-0.068
-0.37%
jan 1, 2012
18.186
-0.015
-0.08%
jan 1, 2013
18.172
-0.013
-0.07%
jan 1, 2014
18.161
-0.011
-0.06%
jan 1, 2015
18.156
-0.005
-0.03%
jan 1, 2016
18.099
-0.057
-0.31%
Ranking of countries by current statistics by years


Comments: