29
/
en
AIzaSyAYiBZKx7MnpbEhh9jyipgxe19OcubqV5w
April 1, 2024
144894
Guatemala
GTM
true
2
1
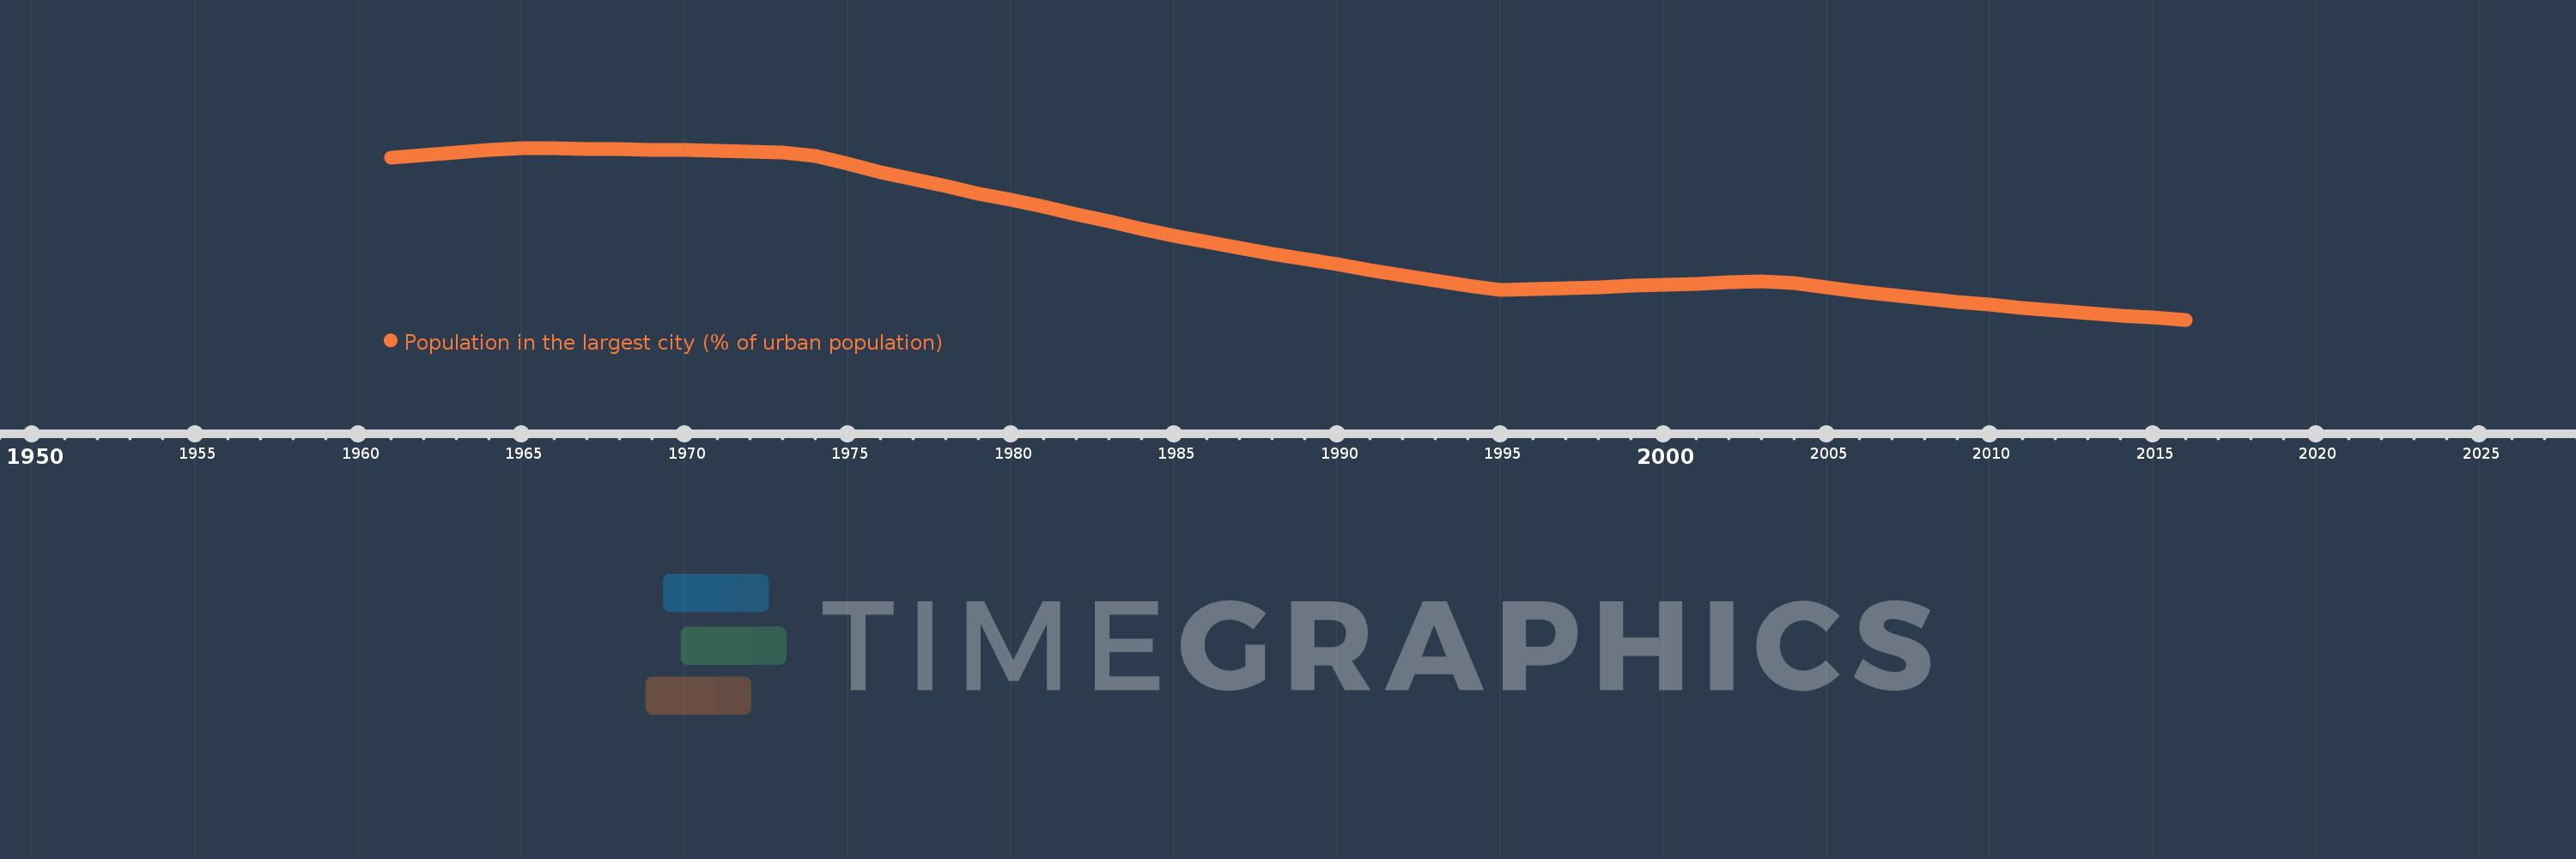
Population in the largest city (% of urban population)
2016,2015,2014,2013,2012,2011,2010,2009,2008,2007,2006,2005,2004,2003,2002,2001,2000,1999,1998,1997,1996,1995,1994,1993,1992,1991,1990,1989,1988,1987,1986,1985,1984,1983,1982,1981,1980,1979,1978,1977,1976,1975,1974,1973,1972,1971,1970,1969,1968,1967,1966,1965,1964,1963,1962,1961
This statistics in other country:
AfghanistanAlbaniaAlgeriaAngolaArab WorldArgentinaArmeniaAustraliaAustriaAzerbaijanBahrainBangladeshBelarusBelgiumBeninBoliviaBosnia and HerzegovinaBrazilBulgariaBurkina FasoBurundiCambodiaCameroonCanadaCentral African RepublicCentral Europe and the BalticsChadChileChinaColombiaCongo, Dem. Rep.Congo, Rep.Costa RicaCote d'IvoireCroatiaCubaCzech RepublicDenmarkDjiboutiDominican RepublicEarly-demographic dividendEast Asia & PacificEast Asia & Pacific (excluding high income)East Asia & Pacific (IDA & IBRD countries)EcuadorEgypt, Arab Rep.El SalvadorEritreaEstoniaEthiopiaEuro areaEurope & Central AsiaEurope & Central Asia (excluding high income)Europe & Central Asia (IDA & IBRD countries)European UnionFinlandFragile and conflict affected situationsFranceGabonGambia, TheGeorgiaGermanyGhanaGreeceGuatemalaGuineaGuinea-BissauHaitiHeavily indebted poor countries (HIPC)High incomeHondurasHong Kong SAR, ChinaHungaryIBRD onlyIDA & IBRD totalIDA blendIDA onlyIDA totalIndiaIndonesiaIran, Islamic Rep.IraqIrelandIsraelItalyJamaicaJapanJordanKazakhstanKenyaKorea, Dem. People’s Rep.Korea, Rep.KuwaitKyrgyz RepublicLao PDRLate-demographic dividendLatin America & Caribbean Latin America & Caribbean (excluding high income)Latin America & the Caribbean (IDA & IBRD countries)LatviaLeast developed countries: UN classificationLebanonLiberiaLibyaLithuaniaLow & middle incomeLow incomeLower middle incomeMacao SAR, ChinaMacedonia, FYRMadagascarMalawiMalaysiaMaliMauritaniaMexicoMiddle East & North AfricaMiddle East & North Africa (excluding high income)Middle East & North Africa (IDA & IBRD countries)Middle incomeMoldovaMongoliaMoroccoMozambiqueMyanmarNamibiaNepalNetherlandsNew ZealandNicaraguaNigerNigeriaNorth AmericaNorwayOECD membersOmanPakistanPanamaPapua New GuineaParaguayPeruPhilippinesPolandPortugalPost-demographic dividendPre-demographic dividendPuerto RicoQatarRomaniaRussian FederationRwandaSaudi ArabiaSenegalSerbiaSierra LeoneSingaporeSlovak RepublicSomaliaSouth AfricaSouth AsiaSouth Asia (IDA & IBRD)South SudanSpainSri LankaSub-Saharan Africa Sub-Saharan Africa (excluding high income)Sub-Saharan Africa (IDA & IBRD countries)SudanSwedenSwitzerlandSyrian Arab RepublicTajikistanTanzaniaThailandTogoTunisiaTurkeyTurkmenistanUgandaUkraineUnited Arab EmiratesUnited KingdomUnited StatesUpper middle incomeUruguayUzbekistanVenezuela, RBVietnamWest Bank and GazaWorldYemen, Rep.ZambiaZimbabwe Timeline:
This timeline shows a graph from 1961 to 2016 of Guatemala. No data until 1960. Number of actual observations by date: 56.
Source name:
World Development Indicators
Source organization:
United Nations, World Urbanization Prospects.
Categories, topics:
Urban Development
Last updated:
apr 23, 2017
Indicators value changes by year
Minimum:
34.626
jan 1, 2016
Maximum:
47.807
jan 1, 1965
At the date of observation
Value
Absolute change
Change from previous value
jan 1, 1961
47.084
+47.084
0.0%
jan 1, 1962
47.272
+0.188
0.4%
jan 1, 1963
47.46
+0.189
0.4%
jan 1, 1964
47.653
+0.193
0.41%
jan 1, 1965
47.807
+0.153
0.32%
jan 1, 1966
47.767
-0.04
-0.08%
jan 1, 1967
47.732
-0.035
-0.07%
jan 1, 1968
47.7
-0.032
-0.07%
jan 1, 1969
47.67
-0.031
-0.06%
jan 1, 1970
47.626
-0.044
-0.09%
jan 1, 1971
47.576
-0.05
-0.11%
jan 1, 1972
47.512
-0.064
-0.13%
jan 1, 1973
47.445
-0.067
-0.14%
jan 1, 1974
47.22
-0.225
-0.47%
jan 1, 1975
46.582
-0.638
-1.35%
jan 1, 1976
45.974
-0.607
-1.3%
jan 1, 1977
45.402
-0.573
-1.25%
jan 1, 1978
44.855
-0.547
-1.2%
jan 1, 1979
44.327
-0.528
-1.18%
jan 1, 1980
43.807
-0.521
-1.17%
jan 1, 1981
43.285
-0.522
-1.19%
jan 1, 1982
42.743
-0.542
-1.25%
jan 1, 1983
42.163
-0.58
-1.36%
jan 1, 1984
41.601
-0.563
-1.33%
jan 1, 1985
41.068
-0.532
-1.28%
jan 1, 1986
40.571
-0.497
-1.21%
jan 1, 1987
40.11
-0.461
-1.14%
jan 1, 1988
39.681
-0.429
-1.07%
jan 1, 1989
39.27
-0.411
-1.03%
jan 1, 1990
38.865
-0.406
-1.03%
jan 1, 1991
38.456
-0.409
-1.05%
jan 1, 1992
38.043
-0.413
-1.07%
jan 1, 1993
37.629
-0.414
-1.09%
jan 1, 1994
37.217
-0.412
-1.09%
jan 1, 1995
36.909
-0.308
-0.83%
jan 1, 1996
36.974
+0.066
0.18%
jan 1, 1997
37.051
+0.077
0.21%
jan 1, 1998
37.134
+0.082
0.22%
jan 1, 1999
37.222
+0.089
0.24%
jan 1, 2000
37.313
+0.09
0.24%
jan 1, 2001
37.403
+0.091
0.24%
jan 1, 2002
37.489
+0.086
0.23%
jan 1, 2003
37.579
+0.09
0.24%
jan 1, 2004
37.419
-0.16
-0.43%
jan 1, 2005
37.103
-0.317
-0.85%
jan 1, 2006
36.803
-0.3
-0.81%
jan 1, 2007
36.523
-0.28
-0.76%
jan 1, 2008
36.26
-0.263
-0.72%
jan 1, 2009
36.014
-0.246
-0.68%
jan 1, 2010
35.779
-0.236
-0.65%
jan 1, 2011
35.555
-0.223
-0.62%
jan 1, 2012
35.343
-0.212
-0.6%
jan 1, 2013
35.143
-0.2
-0.57%
jan 1, 2014
34.955
-0.188
-0.54%
jan 1, 2015
34.776
-0.179
-0.51%
jan 1, 2016
34.626
-0.15
-0.43%
Ranking of countries by current statistics by years


Comments: