29
/
en
AIzaSyAYiBZKx7MnpbEhh9jyipgxe19OcubqV5w
April 1, 2024
216945
Pakistan
PAK
true
2
1
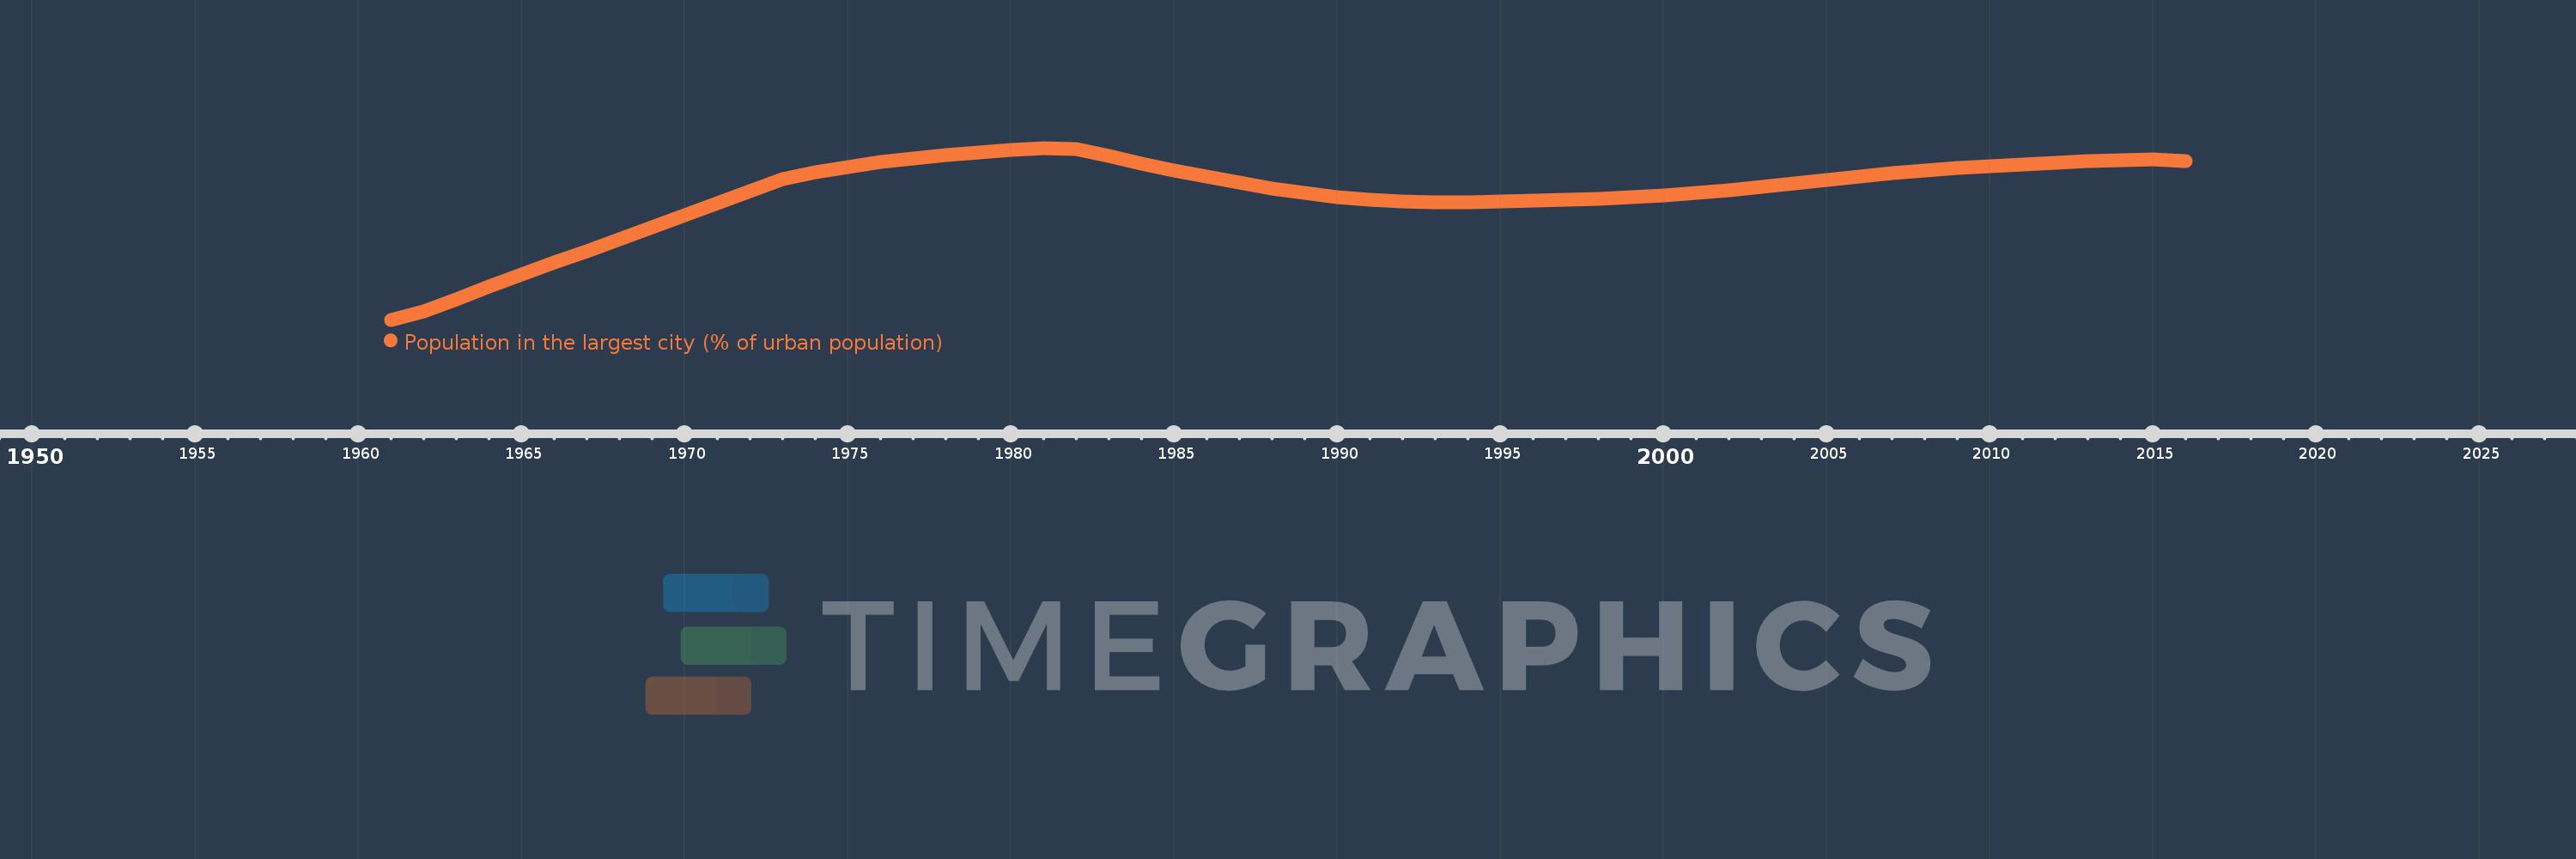
Population in the largest city (% of urban population)
2016,2015,2014,2013,2012,2011,2010,2009,2008,2007,2006,2005,2004,2003,2002,2001,2000,1999,1998,1997,1996,1995,1994,1993,1992,1991,1990,1989,1988,1987,1986,1985,1984,1983,1982,1981,1980,1979,1978,1977,1976,1975,1974,1973,1972,1971,1970,1969,1968,1967,1966,1965,1964,1963,1962,1961
This statistics in other country:
AfghanistanAlbaniaAlgeriaAngolaArab WorldArgentinaArmeniaAustraliaAustriaAzerbaijanBahrainBangladeshBelarusBelgiumBeninBoliviaBosnia and HerzegovinaBrazilBulgariaBurkina FasoBurundiCambodiaCameroonCanadaCentral African RepublicCentral Europe and the BalticsChadChileChinaColombiaCongo, Dem. Rep.Congo, Rep.Costa RicaCote d'IvoireCroatiaCubaCzech RepublicDenmarkDjiboutiDominican RepublicEarly-demographic dividendEast Asia & PacificEast Asia & Pacific (excluding high income)East Asia & Pacific (IDA & IBRD countries)EcuadorEgypt, Arab Rep.El SalvadorEritreaEstoniaEthiopiaEuro areaEurope & Central AsiaEurope & Central Asia (excluding high income)Europe & Central Asia (IDA & IBRD countries)European UnionFinlandFragile and conflict affected situationsFranceGabonGambia, TheGeorgiaGermanyGhanaGreeceGuatemalaGuineaGuinea-BissauHaitiHeavily indebted poor countries (HIPC)High incomeHondurasHong Kong SAR, ChinaHungaryIBRD onlyIDA & IBRD totalIDA blendIDA onlyIDA totalIndiaIndonesiaIran, Islamic Rep.IraqIrelandIsraelItalyJamaicaJapanJordanKazakhstanKenyaKorea, Dem. People’s Rep.Korea, Rep.KuwaitKyrgyz RepublicLao PDRLate-demographic dividendLatin America & Caribbean Latin America & Caribbean (excluding high income)Latin America & the Caribbean (IDA & IBRD countries)LatviaLeast developed countries: UN classificationLebanonLiberiaLibyaLithuaniaLow & middle incomeLow incomeLower middle incomeMacao SAR, ChinaMacedonia, FYRMadagascarMalawiMalaysiaMaliMauritaniaMexicoMiddle East & North AfricaMiddle East & North Africa (excluding high income)Middle East & North Africa (IDA & IBRD countries)Middle incomeMoldovaMongoliaMoroccoMozambiqueMyanmarNamibiaNepalNetherlandsNew ZealandNicaraguaNigerNigeriaNorth AmericaNorwayOECD membersOmanPakistanPanamaPapua New GuineaParaguayPeruPhilippinesPolandPortugalPost-demographic dividendPre-demographic dividendPuerto RicoQatarRomaniaRussian FederationRwandaSaudi ArabiaSenegalSerbiaSierra LeoneSingaporeSlovak RepublicSomaliaSouth AfricaSouth AsiaSouth Asia (IDA & IBRD)South SudanSpainSri LankaSub-Saharan Africa Sub-Saharan Africa (excluding high income)Sub-Saharan Africa (IDA & IBRD countries)SudanSwedenSwitzerlandSyrian Arab RepublicTajikistanTanzaniaThailandTogoTunisiaTurkeyTurkmenistanUgandaUkraineUnited Arab EmiratesUnited KingdomUnited StatesUpper middle incomeUruguayUzbekistanVenezuela, RBVietnamWest Bank and GazaWorldYemen, Rep.ZambiaZimbabwe Timeline:
This timeline shows a graph from 1961 to 2016 of Pakistan. No data until 1960. Number of actual observations by date: 56.
Source name:
World Development Indicators
Source organization:
United Nations, World Urbanization Prospects.
Categories, topics:
Urban Development
Last updated:
apr 23, 2017
Indicators value changes by year
Minimum:
18.669
jan 1, 1961
Maximum:
23.037
jan 1, 1981
At the date of observation
Value
Absolute change
Change from previous value
jan 1, 1961
18.669
+18.669
0.0%
jan 1, 1962
18.879
+0.21
1.13%
jan 1, 1963
19.194
+0.315
1.67%
jan 1, 1964
19.505
+0.311
1.62%
jan 1, 1965
19.813
+0.308
1.58%
jan 1, 1966
20.117
+0.304
1.53%
jan 1, 1967
20.42
+0.303
1.5%
jan 1, 1968
20.722
+0.302
1.48%
jan 1, 1969
21.025
+0.303
1.46%
jan 1, 1970
21.326
+0.302
1.43%
jan 1, 1971
21.632
+0.305
1.43%
jan 1, 1972
21.94
+0.309
1.43%
jan 1, 1973
22.252
+0.311
1.42%
jan 1, 1974
22.428
+0.176
0.79%
jan 1, 1975
22.559
+0.131
0.58%
jan 1, 1976
22.674
+0.115
0.51%
jan 1, 1977
22.774
+0.1
0.44%
jan 1, 1978
22.859
+0.084
0.37%
jan 1, 1979
22.931
+0.072
0.32%
jan 1, 1980
22.99
+0.059
0.26%
jan 1, 1981
23.037
+0.047
0.2%
jan 1, 1982
23.002
-0.035
-0.15%
jan 1, 1983
22.823
-0.179
-0.78%
jan 1, 1984
22.643
-0.179
-0.79%
jan 1, 1985
22.47
-0.173
-0.76%
jan 1, 1986
22.306
-0.164
-0.73%
jan 1, 1987
22.154
-0.152
-0.68%
jan 1, 1988
22.014
-0.14
-0.63%
jan 1, 1989
21.892
-0.121
-0.55%
jan 1, 1990
21.794
-0.099
-0.45%
jan 1, 1991
21.722
-0.071
-0.33%
jan 1, 1992
21.679
-0.043
-0.2%
jan 1, 1993
21.663
-0.016
-0.08%
jan 1, 1994
21.664
+0.001
0.0%
jan 1, 1995
21.676
+0.013
0.06%
jan 1, 1996
21.694
+0.018
0.08%
jan 1, 1997
21.716
+0.021
0.1%
jan 1, 1998
21.741
+0.026
0.12%
jan 1, 1999
21.778
+0.037
0.17%
jan 1, 2000
21.825
+0.047
0.22%
jan 1, 2001
21.886
+0.061
0.28%
jan 1, 2002
21.962
+0.076
0.35%
jan 1, 2003
22.048
+0.086
0.39%
jan 1, 2004
22.14
+0.092
0.42%
jan 1, 2005
22.231
+0.09
0.41%
jan 1, 2006
22.315
+0.084
0.38%
jan 1, 2007
22.392
+0.077
0.34%
jan 1, 2008
22.462
+0.07
0.31%
jan 1, 2009
22.524
+0.063
0.28%
jan 1, 2010
22.579
+0.055
0.24%
jan 1, 2011
22.626
+0.047
0.21%
jan 1, 2012
22.664
+0.038
0.17%
jan 1, 2013
22.696
+0.031
0.14%
jan 1, 2014
22.724
+0.028
0.12%
jan 1, 2015
22.752
+0.028
0.12%
jan 1, 2016
22.694
-0.057
-0.25%
Ranking of countries by current statistics by years


Comments: