29
/
en
AIzaSyAYiBZKx7MnpbEhh9jyipgxe19OcubqV5w
April 1, 2024
51309
Middle income
MIC
false
2
1
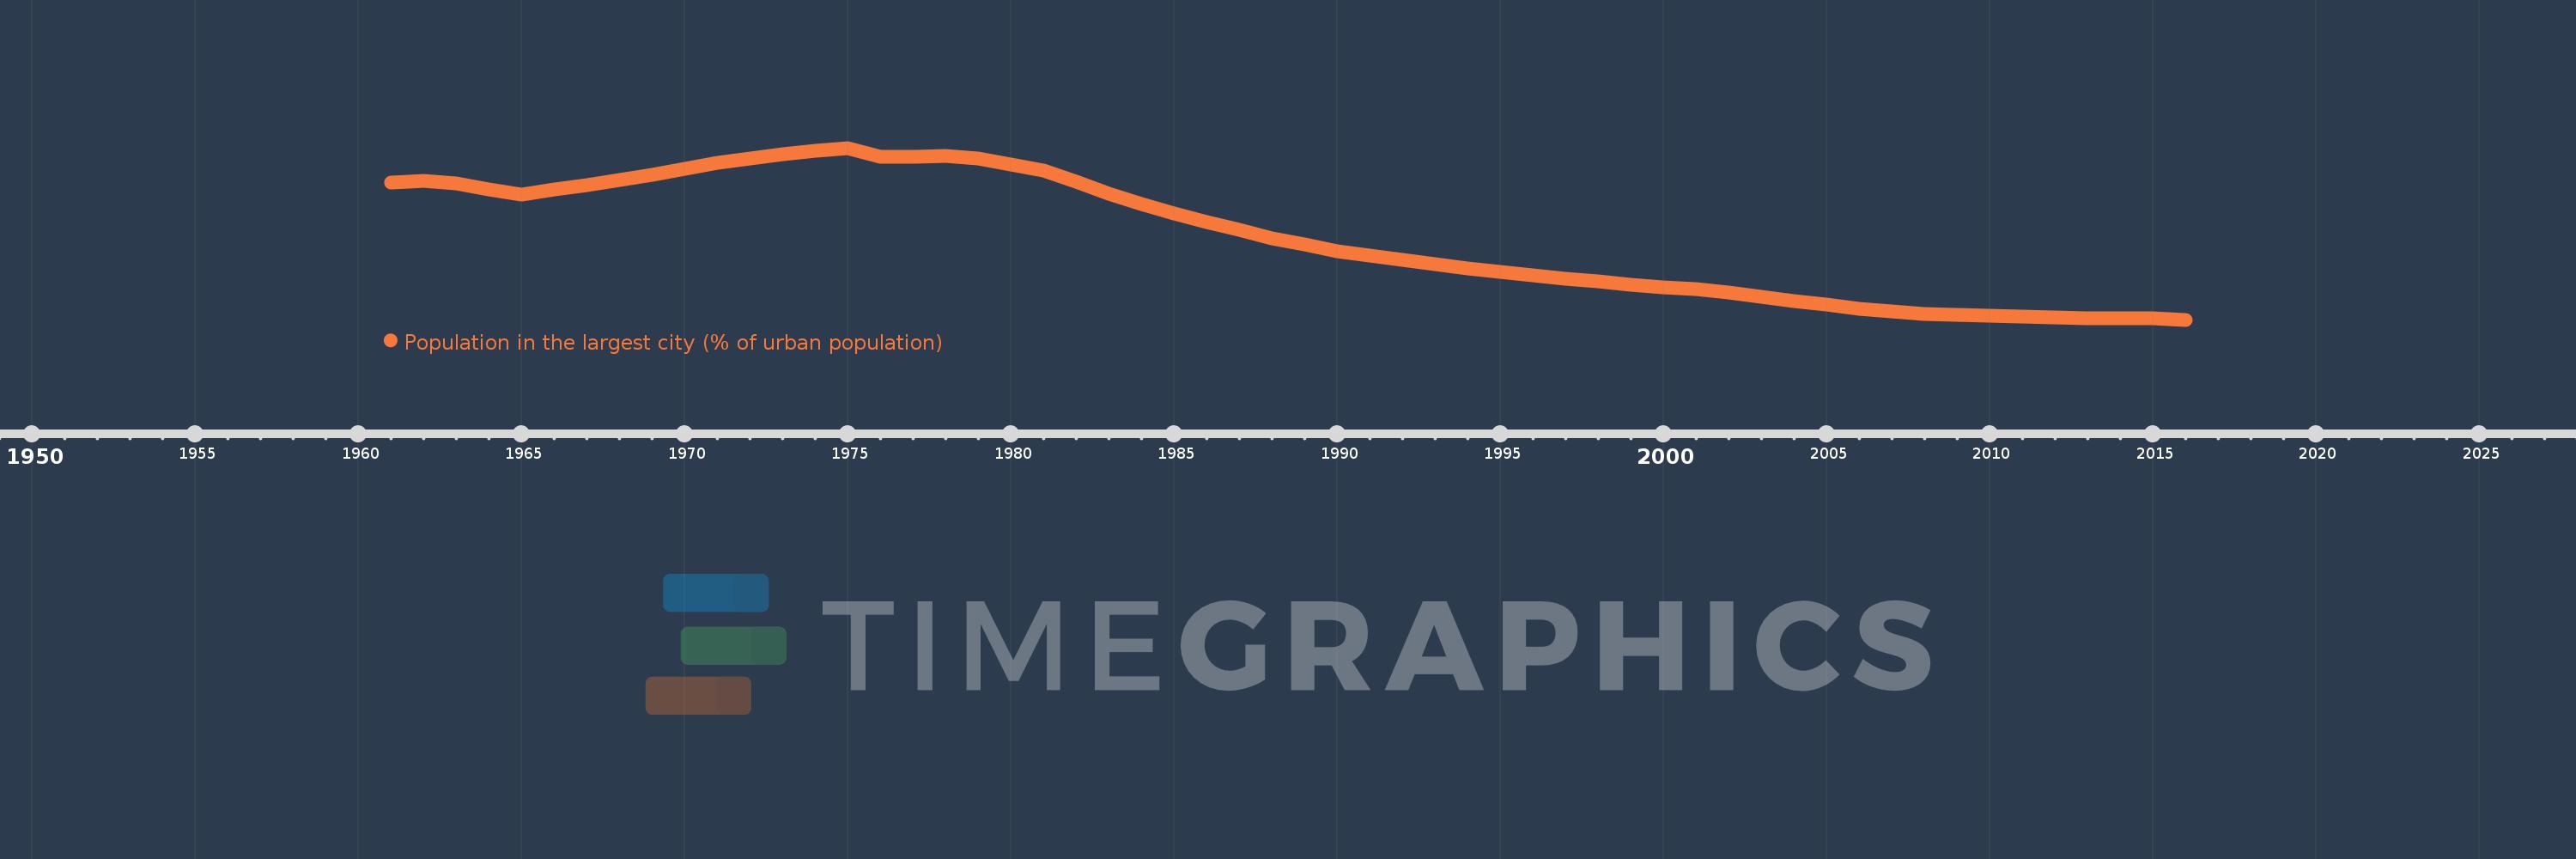
Population in the largest city (% of urban population)
2016,2015,2014,2013,2012,2011,2010,2009,2008,2007,2006,2005,2004,2003,2002,2001,2000,1999,1998,1997,1996,1995,1994,1993,1992,1991,1990,1989,1988,1987,1986,1985,1984,1983,1982,1981,1980,1979,1978,1977,1976,1975,1974,1973,1972,1971,1970,1969,1968,1967,1966,1965,1964,1963,1962,1961
This statistics in other country:
AfghanistanAlbaniaAlgeriaAngolaArab WorldArgentinaArmeniaAustraliaAustriaAzerbaijanBahrainBangladeshBelarusBelgiumBeninBoliviaBosnia and HerzegovinaBrazilBulgariaBurkina FasoBurundiCambodiaCameroonCanadaCentral African RepublicCentral Europe and the BalticsChadChileChinaColombiaCongo, Dem. Rep.Congo, Rep.Costa RicaCote d'IvoireCroatiaCubaCzech RepublicDenmarkDjiboutiDominican RepublicEarly-demographic dividendEast Asia & PacificEast Asia & Pacific (excluding high income)East Asia & Pacific (IDA & IBRD countries)EcuadorEgypt, Arab Rep.El SalvadorEritreaEstoniaEthiopiaEuro areaEurope & Central AsiaEurope & Central Asia (excluding high income)Europe & Central Asia (IDA & IBRD countries)European UnionFinlandFragile and conflict affected situationsFranceGabonGambia, TheGeorgiaGermanyGhanaGreeceGuatemalaGuineaGuinea-BissauHaitiHeavily indebted poor countries (HIPC)High incomeHondurasHong Kong SAR, ChinaHungaryIBRD onlyIDA & IBRD totalIDA blendIDA onlyIDA totalIndiaIndonesiaIran, Islamic Rep.IraqIrelandIsraelItalyJamaicaJapanJordanKazakhstanKenyaKorea, Dem. People’s Rep.Korea, Rep.KuwaitKyrgyz RepublicLao PDRLate-demographic dividendLatin America & Caribbean Latin America & Caribbean (excluding high income)Latin America & the Caribbean (IDA & IBRD countries)LatviaLeast developed countries: UN classificationLebanonLiberiaLibyaLithuaniaLow & middle incomeLow incomeLower middle incomeMacao SAR, ChinaMacedonia, FYRMadagascarMalawiMalaysiaMaliMauritaniaMexicoMiddle East & North AfricaMiddle East & North Africa (excluding high income)Middle East & North Africa (IDA & IBRD countries)Middle incomeMoldovaMongoliaMoroccoMozambiqueMyanmarNamibiaNepalNetherlandsNew ZealandNicaraguaNigerNigeriaNorth AmericaNorwayOECD membersOmanPakistanPanamaPapua New GuineaParaguayPeruPhilippinesPolandPortugalPost-demographic dividendPre-demographic dividendPuerto RicoQatarRomaniaRussian FederationRwandaSaudi ArabiaSenegalSerbiaSierra LeoneSingaporeSlovak RepublicSomaliaSouth AfricaSouth AsiaSouth Asia (IDA & IBRD)South SudanSpainSri LankaSub-Saharan Africa Sub-Saharan Africa (excluding high income)Sub-Saharan Africa (IDA & IBRD countries)SudanSwedenSwitzerlandSyrian Arab RepublicTajikistanTanzaniaThailandTogoTunisiaTurkeyTurkmenistanUgandaUkraineUnited Arab EmiratesUnited KingdomUnited StatesUpper middle incomeUruguayUzbekistanVenezuela, RBVietnamWest Bank and GazaWorldYemen, Rep.ZambiaZimbabwe Timeline:
This timeline shows a graph from 1961 to 2016 of Middle income. No data until 1960. Number of actual observations by date: 56.
Source name:
World Development Indicators
Source organization:
United Nations, World Urbanization Prospects.
Categories, topics:
Urban Development
Last updated:
apr 23, 2017
Indicators value changes by year
Minimum:
14.232
jan 1, 2016
At the date of observation
Value
Absolute change
Change from previous value
jan 1, 1961
16.399
+16.399
0.0%
jan 1, 1962
16.425
+0.026
0.16%
jan 1, 1963
16.382
-0.043
-0.26%
jan 1, 1964
16.288
-0.094
-0.57%
jan 1, 1965
16.203
-0.085
-0.52%
jan 1, 1966
16.28
+0.077
0.48%
jan 1, 1967
16.358
+0.078
0.48%
jan 1, 1968
16.434
+0.076
0.46%
jan 1, 1969
16.52
+0.086
0.52%
jan 1, 1970
16.612
+0.092
0.56%
jan 1, 1971
16.706
+0.095
0.57%
jan 1, 1972
16.774
+0.068
0.41%
jan 1, 1973
16.843
+0.068
0.41%
jan 1, 1974
16.899
+0.056
0.33%
jan 1, 1975
16.94
+0.041
0.24%
jan 1, 1976
16.795
-0.145
-0.85%
jan 1, 1977
16.804
+0.009
0.05%
jan 1, 1978
16.809
+0.005
0.03%
jan 1, 1979
16.774
-0.036
-0.21%
jan 1, 1980
16.678
-0.096
-0.57%
jan 1, 1981
16.582
-0.095
-0.57%
jan 1, 1982
16.412
-0.17
-1.03%
jan 1, 1983
16.22
-0.192
-1.17%
jan 1, 1984
16.056
-0.164
-1.01%
jan 1, 1985
15.912
-0.145
-0.9%
jan 1, 1986
15.774
-0.138
-0.87%
jan 1, 1987
15.643
-0.131
-0.83%
jan 1, 1988
15.52
-0.122
-0.78%
jan 1, 1989
15.413
-0.107
-0.69%
jan 1, 1990
15.313
-0.101
-0.65%
jan 1, 1991
15.239
-0.073
-0.48%
jan 1, 1992
15.173
-0.067
-0.44%
jan 1, 1993
15.103
-0.07
-0.46%
jan 1, 1994
15.037
-0.066
-0.44%
jan 1, 1995
14.98
-0.057
-0.38%
jan 1, 1996
14.932
-0.048
-0.32%
jan 1, 1997
14.881
-0.051
-0.34%
jan 1, 1998
14.831
-0.05
-0.34%
jan 1, 1999
14.785
-0.047
-0.32%
jan 1, 2000
14.744
-0.041
-0.28%
jan 1, 2001
14.71
-0.034
-0.23%
jan 1, 2002
14.659
-0.051
-0.34%
jan 1, 2003
14.592
-0.067
-0.46%
jan 1, 2004
14.531
-0.061
-0.42%
jan 1, 2005
14.466
-0.066
-0.45%
jan 1, 2006
14.407
-0.059
-0.41%
jan 1, 2007
14.36
-0.047
-0.33%
jan 1, 2008
14.322
-0.038
-0.27%
jan 1, 2009
14.314
-0.007
-0.05%
jan 1, 2010
14.292
-0.022
-0.15%
jan 1, 2011
14.276
-0.016
-0.11%
jan 1, 2012
14.264
-0.012
-0.09%
jan 1, 2013
14.256
-0.008
-0.06%
jan 1, 2014
14.253
-0.003
-0.02%
jan 1, 2015
14.259
+0.006
0.04%
jan 1, 2016
14.232
-0.027
-0.19%
Ranking of countries by current statistics by years


Comments: