29
/
en
AIzaSyAYiBZKx7MnpbEhh9jyipgxe19OcubqV5w
April 1, 2024
214700
Norway
NOR
true
2
1
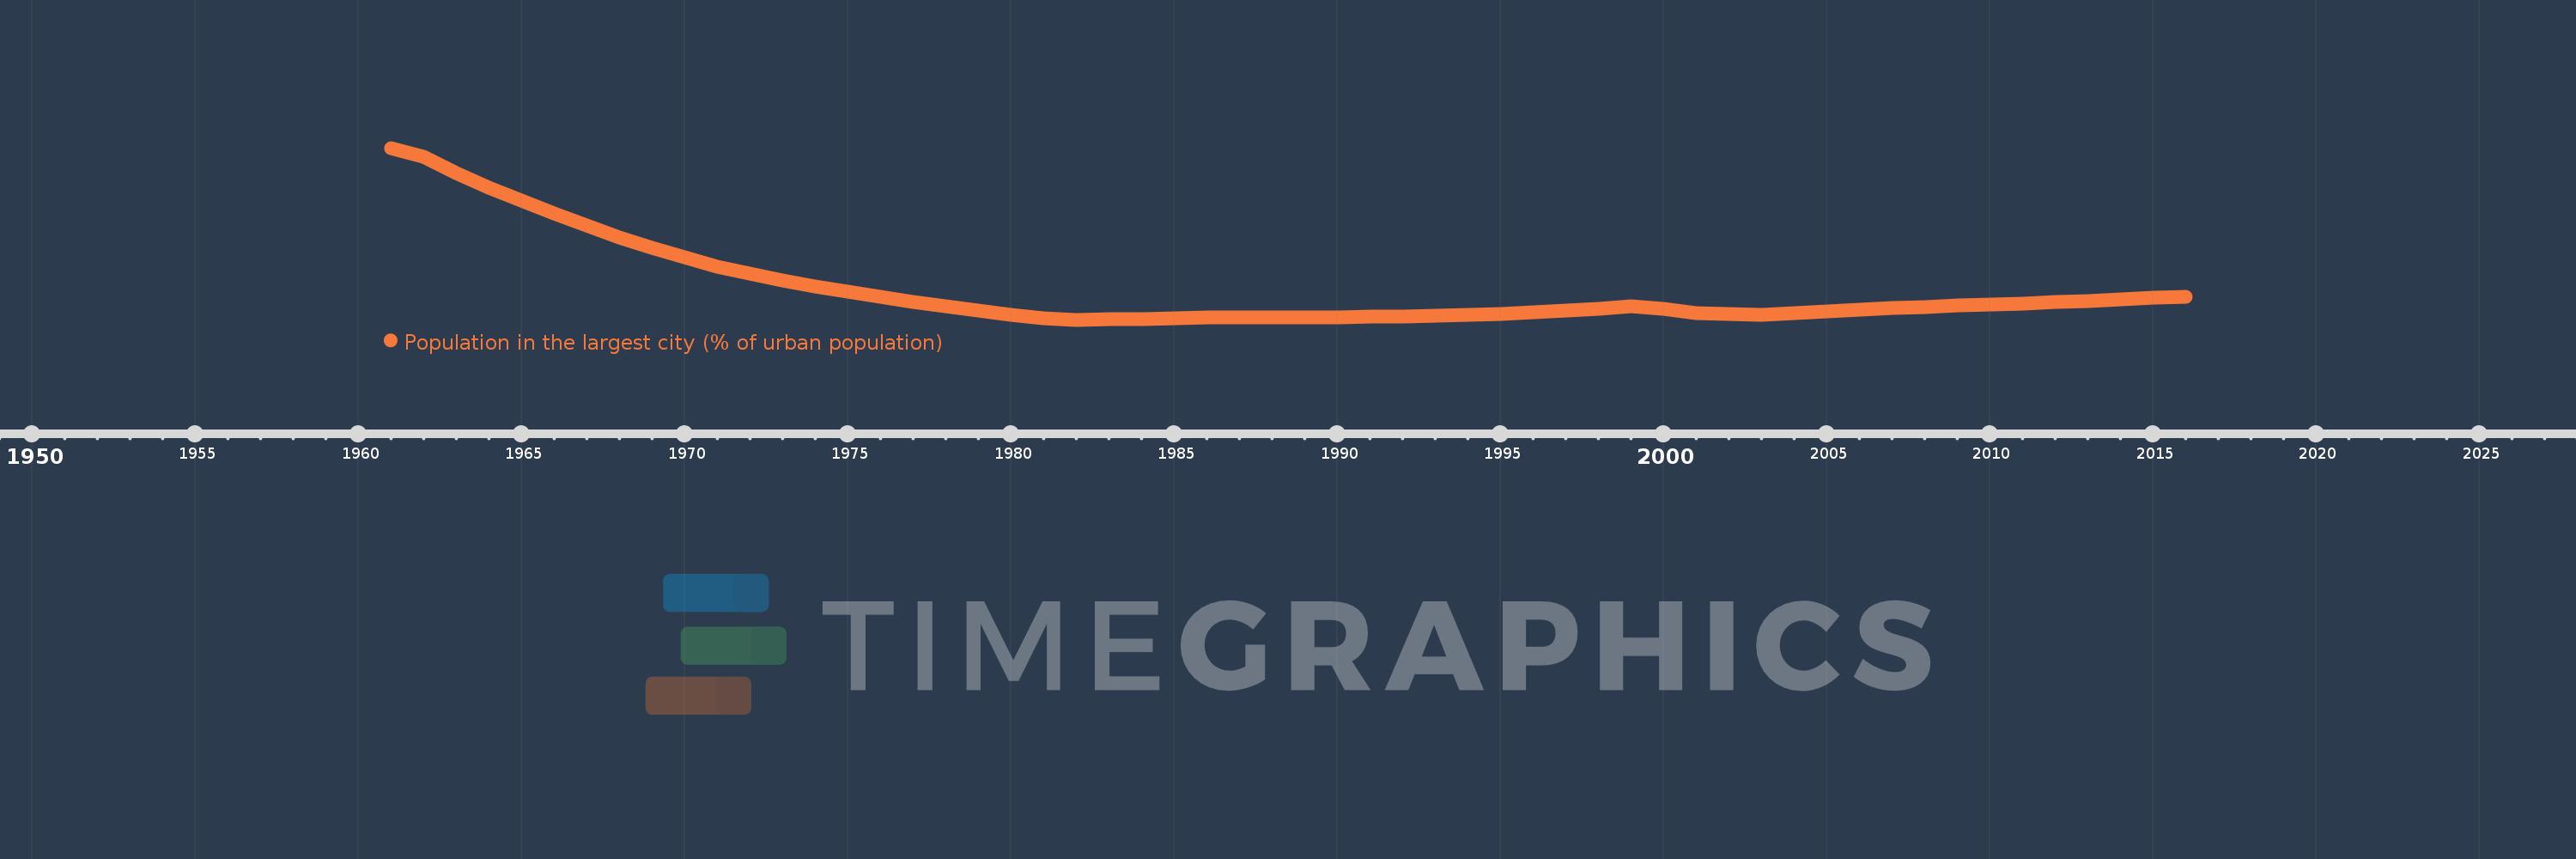
Population in the largest city (% of urban population)
2016,2015,2014,2013,2012,2011,2010,2009,2008,2007,2006,2005,2004,2003,2002,2001,2000,1999,1998,1997,1996,1995,1994,1993,1992,1991,1990,1989,1988,1987,1986,1985,1984,1983,1982,1981,1980,1979,1978,1977,1976,1975,1974,1973,1972,1971,1970,1969,1968,1967,1966,1965,1964,1963,1962,1961
This statistics in other country:
AfghanistanAlbaniaAlgeriaAngolaArab WorldArgentinaArmeniaAustraliaAustriaAzerbaijanBahrainBangladeshBelarusBelgiumBeninBoliviaBosnia and HerzegovinaBrazilBulgariaBurkina FasoBurundiCambodiaCameroonCanadaCentral African RepublicCentral Europe and the BalticsChadChileChinaColombiaCongo, Dem. Rep.Congo, Rep.Costa RicaCote d'IvoireCroatiaCubaCzech RepublicDenmarkDjiboutiDominican RepublicEarly-demographic dividendEast Asia & PacificEast Asia & Pacific (excluding high income)East Asia & Pacific (IDA & IBRD countries)EcuadorEgypt, Arab Rep.El SalvadorEritreaEstoniaEthiopiaEuro areaEurope & Central AsiaEurope & Central Asia (excluding high income)Europe & Central Asia (IDA & IBRD countries)European UnionFinlandFragile and conflict affected situationsFranceGabonGambia, TheGeorgiaGermanyGhanaGreeceGuatemalaGuineaGuinea-BissauHaitiHeavily indebted poor countries (HIPC)High incomeHondurasHong Kong SAR, ChinaHungaryIBRD onlyIDA & IBRD totalIDA blendIDA onlyIDA totalIndiaIndonesiaIran, Islamic Rep.IraqIrelandIsraelItalyJamaicaJapanJordanKazakhstanKenyaKorea, Dem. People’s Rep.Korea, Rep.KuwaitKyrgyz RepublicLao PDRLate-demographic dividendLatin America & Caribbean Latin America & Caribbean (excluding high income)Latin America & the Caribbean (IDA & IBRD countries)LatviaLeast developed countries: UN classificationLebanonLiberiaLibyaLithuaniaLow & middle incomeLow incomeLower middle incomeMacao SAR, ChinaMacedonia, FYRMadagascarMalawiMalaysiaMaliMauritaniaMexicoMiddle East & North AfricaMiddle East & North Africa (excluding high income)Middle East & North Africa (IDA & IBRD countries)Middle incomeMoldovaMongoliaMoroccoMozambiqueMyanmarNamibiaNepalNetherlandsNew ZealandNicaraguaNigerNigeriaNorth AmericaNorwayOECD membersOmanPakistanPanamaPapua New GuineaParaguayPeruPhilippinesPolandPortugalPost-demographic dividendPre-demographic dividendPuerto RicoQatarRomaniaRussian FederationRwandaSaudi ArabiaSenegalSerbiaSierra LeoneSingaporeSlovak RepublicSomaliaSouth AfricaSouth AsiaSouth Asia (IDA & IBRD)South SudanSpainSri LankaSub-Saharan Africa Sub-Saharan Africa (excluding high income)Sub-Saharan Africa (IDA & IBRD countries)SudanSwedenSwitzerlandSyrian Arab RepublicTajikistanTanzaniaThailandTogoTunisiaTurkeyTurkmenistanUgandaUkraineUnited Arab EmiratesUnited KingdomUnited StatesUpper middle incomeUruguayUzbekistanVenezuela, RBVietnamWest Bank and GazaWorldYemen, Rep.ZambiaZimbabwe Timeline:
This timeline shows a graph from 1961 to 2016 of Norway. No data until 1960. Number of actual observations by date: 56.
Source name:
World Development Indicators
Source organization:
United Nations, World Urbanization Prospects.
Categories, topics:
Urban Development
Last updated:
apr 23, 2017
Indicators value changes by year
Minimum:
22.249
jan 1, 1982
Maximum:
32.334
jan 1, 1961
At the date of observation
Value
Absolute change
Change from previous value
jan 1, 1961
32.334
+32.334
0.0%
jan 1, 1962
31.79
-0.544
-1.68%
jan 1, 1963
30.866
-0.924
-2.91%
jan 1, 1964
30.017
-0.85
-2.75%
jan 1, 1965
29.221
-0.795
-2.65%
jan 1, 1966
28.474
-0.748
-2.56%
jan 1, 1967
27.768
-0.706
-2.48%
jan 1, 1968
27.098
-0.67
-2.41%
jan 1, 1969
26.471
-0.627
-2.31%
jan 1, 1970
25.893
-0.579
-2.19%
jan 1, 1971
25.374
-0.518
-2.0%
jan 1, 1972
24.961
-0.413
-1.63%
jan 1, 1973
24.578
-0.383
-1.54%
jan 1, 1974
24.219
-0.359
-1.46%
jan 1, 1975
23.887
-0.332
-1.37%
jan 1, 1976
23.578
-0.309
-1.29%
jan 1, 1977
23.295
-0.283
-1.2%
jan 1, 1978
23.029
-0.266
-1.14%
jan 1, 1979
22.777
-0.252
-1.09%
jan 1, 1980
22.539
-0.237
-1.04%
jan 1, 1981
22.311
-0.229
-1.01%
jan 1, 1982
22.249
-0.061
-0.27%
jan 1, 1983
22.269
+0.02
0.09%
jan 1, 1984
22.297
+0.028
0.13%
jan 1, 1985
22.336
+0.039
0.18%
jan 1, 1986
22.372
+0.035
0.16%
jan 1, 1987
22.394
+0.023
0.1%
jan 1, 1988
22.392
-0.002
-0.01%
jan 1, 1989
22.375
-0.017
-0.08%
jan 1, 1990
22.386
+0.011
0.05%
jan 1, 1991
22.412
+0.027
0.12%
jan 1, 1992
22.454
+0.042
0.19%
jan 1, 1993
22.499
+0.045
0.2%
jan 1, 1994
22.541
+0.042
0.19%
jan 1, 1995
22.592
+0.05
0.22%
jan 1, 1996
22.679
+0.087
0.39%
jan 1, 1997
22.781
+0.102
0.45%
jan 1, 1998
22.877
+0.096
0.42%
jan 1, 1999
23.024
+0.148
0.65%
jan 1, 2000
22.9
-0.125
-0.54%
jan 1, 2001
22.647
-0.252
-1.1%
jan 1, 2002
22.584
-0.063
-0.28%
jan 1, 2003
22.561
-0.023
-0.1%
jan 1, 2004
22.624
+0.063
0.28%
jan 1, 2005
22.741
+0.117
0.52%
jan 1, 2006
22.846
+0.105
0.46%
jan 1, 2007
22.929
+0.083
0.36%
jan 1, 2008
23.003
+0.075
0.33%
jan 1, 2009
23.075
+0.072
0.31%
jan 1, 2010
23.143
+0.068
0.3%
jan 1, 2011
23.217
+0.074
0.32%
jan 1, 2012
23.28
+0.063
0.27%
jan 1, 2013
23.341
+0.061
0.26%
jan 1, 2014
23.429
+0.088
0.38%
jan 1, 2015
23.538
+0.109
0.46%
jan 1, 2016
23.583
+0.046
0.19%
Ranking of countries by current statistics by years


Comments: