29
/
en
AIzaSyAYiBZKx7MnpbEhh9jyipgxe19OcubqV5w
April 1, 2024
128708
Eritrea
ERI
true
2
1
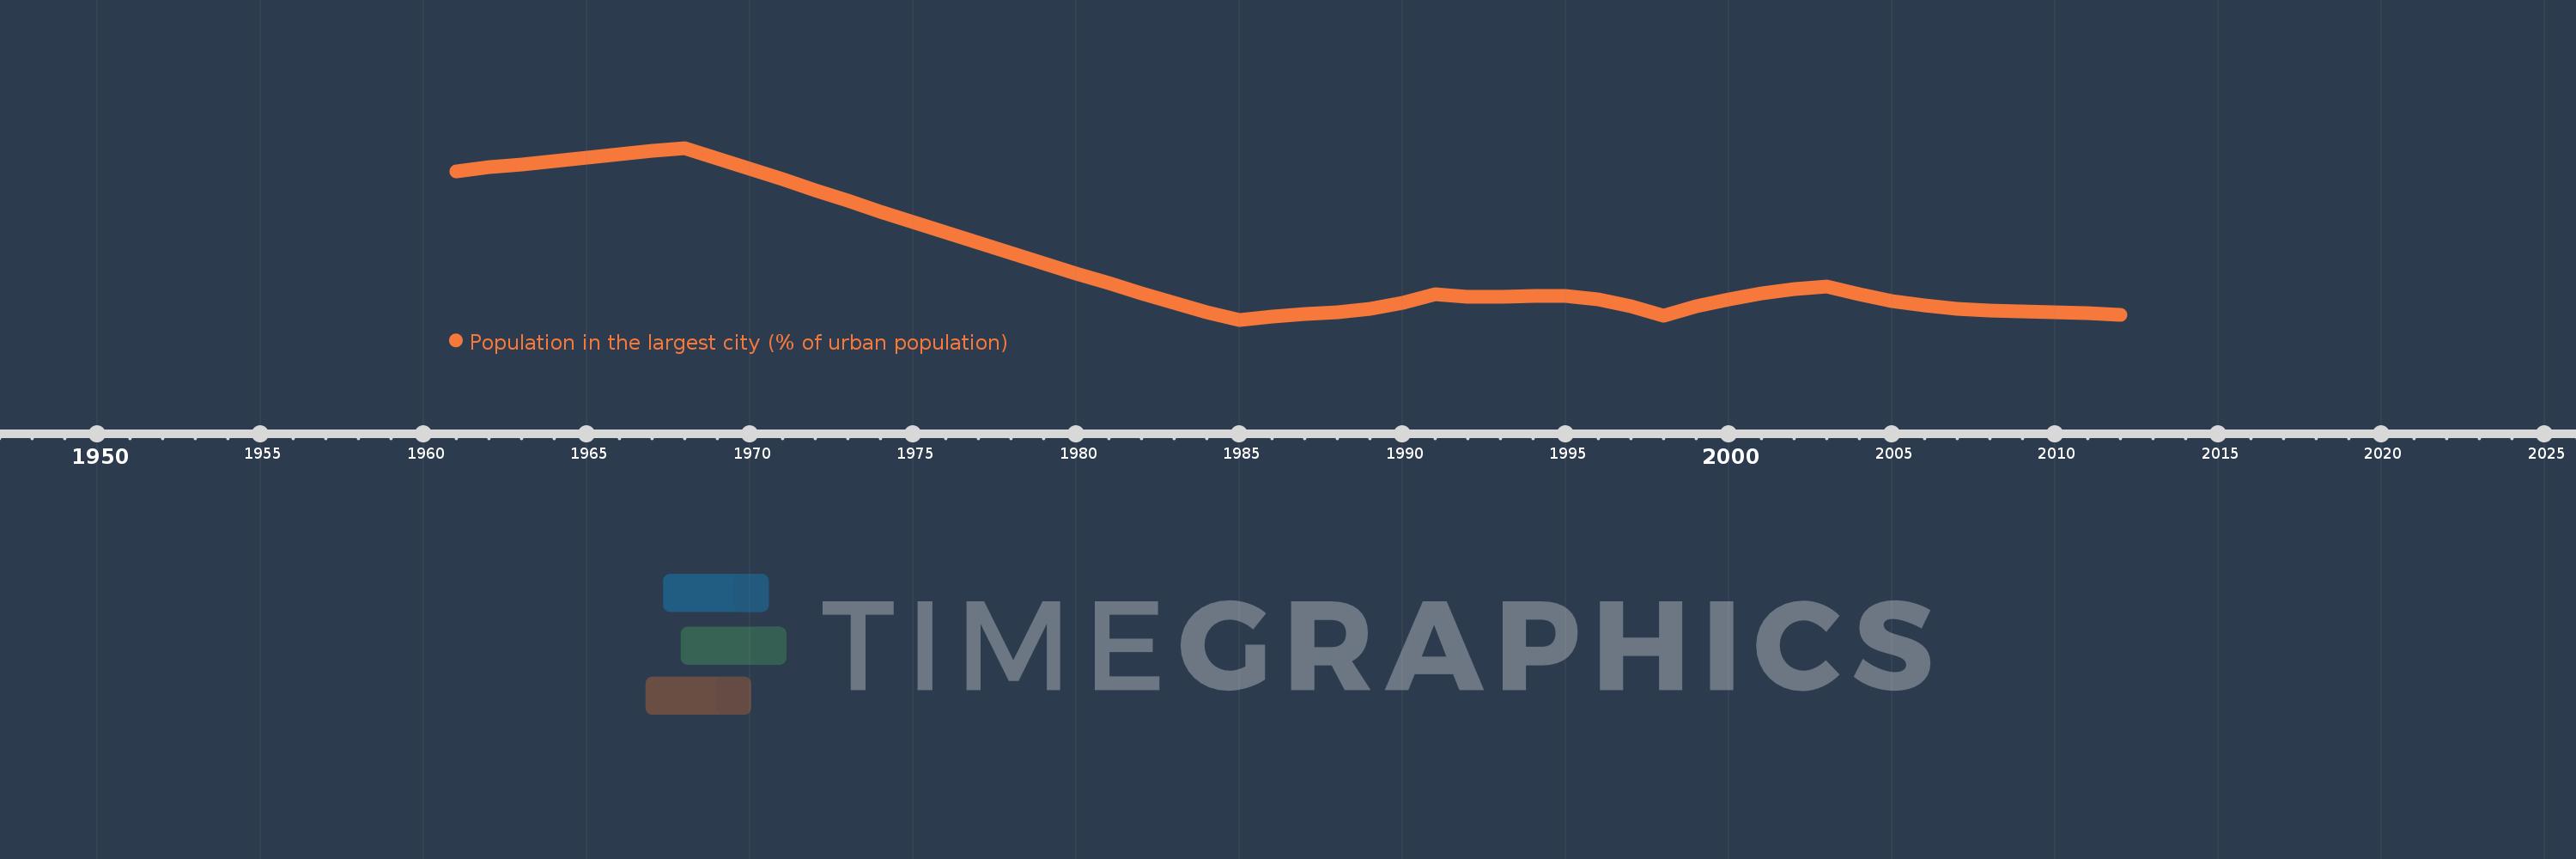
Population in the largest city (% of urban population)
2012,2011,2010,2009,2008,2007,2006,2005,2004,2003,2002,2001,2000,1999,1998,1997,1996,1995,1994,1993,1992,1991,1990,1989,1988,1987,1986,1985,1984,1983,1982,1981,1980,1979,1978,1977,1976,1975,1974,1973,1972,1971,1970,1969,1968,1967,1966,1965,1964,1963,1962,1961
This statistics in other country:
AfghanistanAlbaniaAlgeriaAngolaArab WorldArgentinaArmeniaAustraliaAustriaAzerbaijanBahrainBangladeshBelarusBelgiumBeninBoliviaBosnia and HerzegovinaBrazilBulgariaBurkina FasoBurundiCambodiaCameroonCanadaCentral African RepublicCentral Europe and the BalticsChadChileChinaColombiaCongo, Dem. Rep.Congo, Rep.Costa RicaCote d'IvoireCroatiaCubaCzech RepublicDenmarkDjiboutiDominican RepublicEarly-demographic dividendEast Asia & PacificEast Asia & Pacific (excluding high income)East Asia & Pacific (IDA & IBRD countries)EcuadorEgypt, Arab Rep.El SalvadorEritreaEstoniaEthiopiaEuro areaEurope & Central AsiaEurope & Central Asia (excluding high income)Europe & Central Asia (IDA & IBRD countries)European UnionFinlandFragile and conflict affected situationsFranceGabonGambia, TheGeorgiaGermanyGhanaGreeceGuatemalaGuineaGuinea-BissauHaitiHeavily indebted poor countries (HIPC)High incomeHondurasHong Kong SAR, ChinaHungaryIBRD onlyIDA & IBRD totalIDA blendIDA onlyIDA totalIndiaIndonesiaIran, Islamic Rep.IraqIrelandIsraelItalyJamaicaJapanJordanKazakhstanKenyaKorea, Dem. People’s Rep.Korea, Rep.KuwaitKyrgyz RepublicLao PDRLate-demographic dividendLatin America & Caribbean Latin America & Caribbean (excluding high income)Latin America & the Caribbean (IDA & IBRD countries)LatviaLeast developed countries: UN classificationLebanonLiberiaLibyaLithuaniaLow & middle incomeLow incomeLower middle incomeMacao SAR, ChinaMacedonia, FYRMadagascarMalawiMalaysiaMaliMauritaniaMexicoMiddle East & North AfricaMiddle East & North Africa (excluding high income)Middle East & North Africa (IDA & IBRD countries)Middle incomeMoldovaMongoliaMoroccoMozambiqueMyanmarNamibiaNepalNetherlandsNew ZealandNicaraguaNigerNigeriaNorth AmericaNorwayOECD membersOmanPakistanPanamaPapua New GuineaParaguayPeruPhilippinesPolandPortugalPost-demographic dividendPre-demographic dividendPuerto RicoQatarRomaniaRussian FederationRwandaSaudi ArabiaSenegalSerbiaSierra LeoneSingaporeSlovak RepublicSomaliaSouth AfricaSouth AsiaSouth Asia (IDA & IBRD)South SudanSpainSri LankaSub-Saharan Africa Sub-Saharan Africa (excluding high income)Sub-Saharan Africa (IDA & IBRD countries)SudanSwedenSwitzerlandSyrian Arab RepublicTajikistanTanzaniaThailandTogoTunisiaTurkeyTurkmenistanUgandaUkraineUnited Arab EmiratesUnited KingdomUnited StatesUpper middle incomeUruguayUzbekistanVenezuela, RBVietnamWest Bank and GazaWorldYemen, Rep.ZambiaZimbabwe Timeline:
This timeline shows a graph from 1961 to 2012 of Eritrea. No data until 1960. Number of actual observations by date: 52.
Source name:
World Development Indicators
Source organization:
United Nations, World Urbanization Prospects.
Categories, topics:
Urban Development
Last updated:
apr 23, 2017
Indicators value changes by year
Minimum:
68.515
jan 1, 1985
Maximum:
93.056
jan 1, 1968
At the date of observation
Value
Absolute change
Change from previous value
jan 1, 1961
89.747
+89.747
0.0%
jan 1, 1962
90.259
+0.512
0.57%
jan 1, 1963
90.745
+0.485
0.54%
jan 1, 1964
91.222
+0.478
0.53%
jan 1, 1965
91.69
+0.467
0.51%
jan 1, 1966
92.145
+0.456
0.5%
jan 1, 1967
92.601
+0.455
0.49%
jan 1, 1968
93.056
+0.455
0.49%
jan 1, 1969
91.563
-1.493
-1.6%
jan 1, 1970
90.062
-1.501
-1.64%
jan 1, 1971
88.55
-1.512
-1.68%
jan 1, 1972
87.017
-1.533
-1.73%
jan 1, 1973
85.488
-1.529
-1.76%
jan 1, 1974
83.955
-1.533
-1.79%
jan 1, 1975
82.436
-1.518
-1.81%
jan 1, 1976
80.936
-1.5
-1.82%
jan 1, 1977
79.464
-1.472
-1.82%
jan 1, 1978
78.013
-1.452
-1.83%
jan 1, 1979
76.578
-1.435
-1.84%
jan 1, 1980
75.145
-1.433
-1.87%
jan 1, 1981
73.712
-1.433
-1.91%
jan 1, 1982
72.303
-1.409
-1.91%
jan 1, 1983
70.941
-1.362
-1.88%
jan 1, 1984
69.6
-1.34
-1.89%
jan 1, 1985
68.515
-1.085
-1.56%
jan 1, 1986
68.936
+0.421
0.61%
jan 1, 1987
69.28
+0.343
0.5%
jan 1, 1988
69.592
+0.312
0.45%
jan 1, 1989
70.08
+0.489
0.7%
jan 1, 1990
70.977
+0.897
1.28%
jan 1, 1991
72.201
+1.224
1.72%
jan 1, 1992
71.763
-0.439
-0.61%
jan 1, 1993
71.778
+0.015
0.02%
jan 1, 1994
71.966
+0.188
0.26%
jan 1, 1995
71.965
-0.001
0.0%
jan 1, 1996
71.483
-0.482
-0.67%
jan 1, 1997
70.469
-1.013
-1.42%
jan 1, 1998
69.031
-1.439
-2.04%
jan 1, 1999
70.398
+1.367
1.98%
jan 1, 2000
71.459
+1.061
1.51%
jan 1, 2001
72.292
+0.833
1.17%
jan 1, 2002
72.857
+0.565
0.78%
jan 1, 2003
73.209
+0.353
0.48%
jan 1, 2004
72.155
-1.055
-1.44%
jan 1, 2005
71.229
-0.926
-1.28%
jan 1, 2006
70.522
-0.706
-0.99%
jan 1, 2007
70.073
-0.449
-0.64%
jan 1, 2008
69.818
-0.255
-0.36%
jan 1, 2009
69.687
-0.131
-0.19%
jan 1, 2010
69.573
-0.114
-0.16%
jan 1, 2011
69.414
-0.159
-0.23%
jan 1, 2012
69.199
-0.215
-0.31%
Ranking of countries by current statistics by years


Comments: