29
/
en
AIzaSyAYiBZKx7MnpbEhh9jyipgxe19OcubqV5w
April 1, 2024
188295
Malaysia
MYS
true
2
1
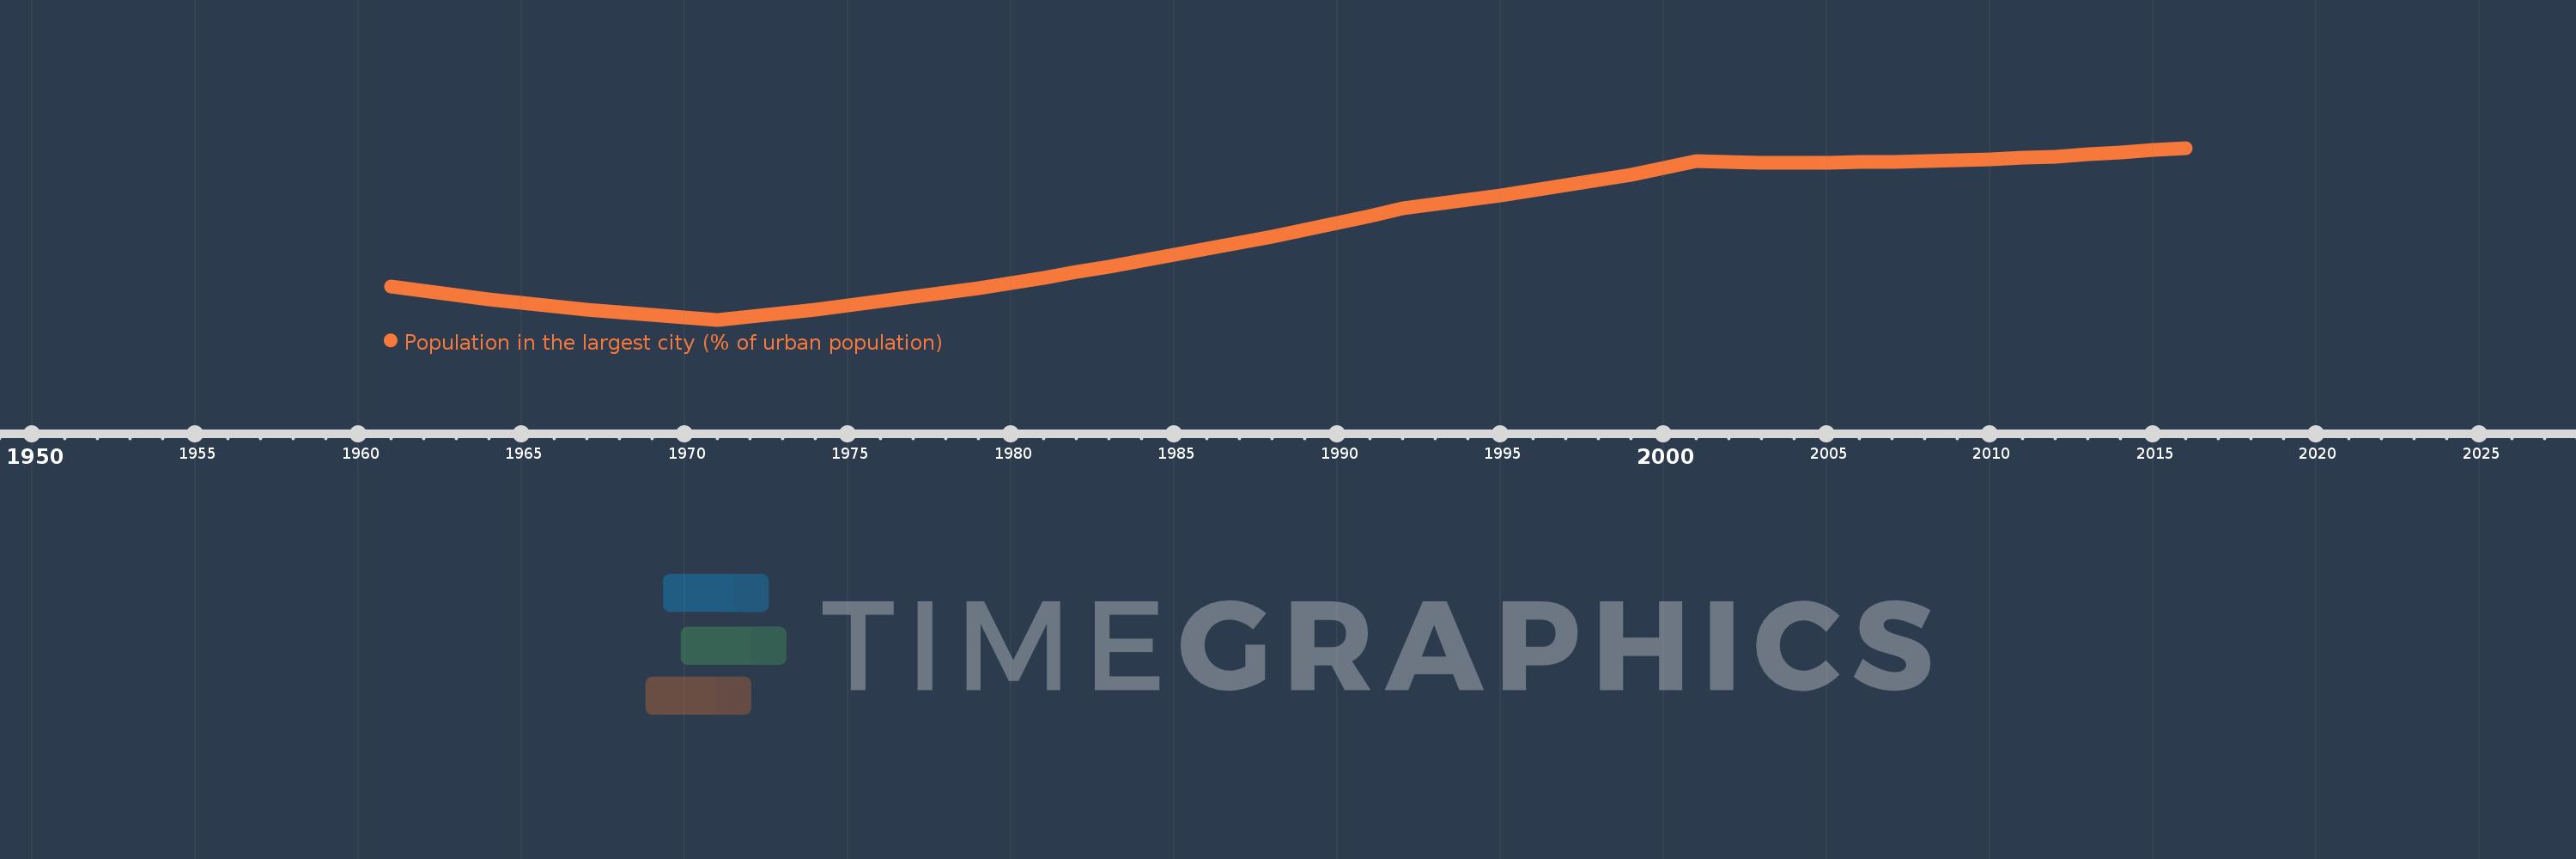
Population in the largest city (% of urban population)
2016,2015,2014,2013,2012,2011,2010,2009,2008,2007,2006,2005,2004,2003,2002,2001,2000,1999,1998,1997,1996,1995,1994,1993,1992,1991,1990,1989,1988,1987,1986,1985,1984,1983,1982,1981,1980,1979,1978,1977,1976,1975,1974,1973,1972,1971,1970,1969,1968,1967,1966,1965,1964,1963,1962,1961
This statistics in other country:
AfghanistanAlbaniaAlgeriaAngolaArab WorldArgentinaArmeniaAustraliaAustriaAzerbaijanBahrainBangladeshBelarusBelgiumBeninBoliviaBosnia and HerzegovinaBrazilBulgariaBurkina FasoBurundiCambodiaCameroonCanadaCentral African RepublicCentral Europe and the BalticsChadChileChinaColombiaCongo, Dem. Rep.Congo, Rep.Costa RicaCote d'IvoireCroatiaCubaCzech RepublicDenmarkDjiboutiDominican RepublicEarly-demographic dividendEast Asia & PacificEast Asia & Pacific (excluding high income)East Asia & Pacific (IDA & IBRD countries)EcuadorEgypt, Arab Rep.El SalvadorEritreaEstoniaEthiopiaEuro areaEurope & Central AsiaEurope & Central Asia (excluding high income)Europe & Central Asia (IDA & IBRD countries)European UnionFinlandFragile and conflict affected situationsFranceGabonGambia, TheGeorgiaGermanyGhanaGreeceGuatemalaGuineaGuinea-BissauHaitiHeavily indebted poor countries (HIPC)High incomeHondurasHong Kong SAR, ChinaHungaryIBRD onlyIDA & IBRD totalIDA blendIDA onlyIDA totalIndiaIndonesiaIran, Islamic Rep.IraqIrelandIsraelItalyJamaicaJapanJordanKazakhstanKenyaKorea, Dem. People’s Rep.Korea, Rep.KuwaitKyrgyz RepublicLao PDRLate-demographic dividendLatin America & Caribbean Latin America & Caribbean (excluding high income)Latin America & the Caribbean (IDA & IBRD countries)LatviaLeast developed countries: UN classificationLebanonLiberiaLibyaLithuaniaLow & middle incomeLow incomeLower middle incomeMacao SAR, ChinaMacedonia, FYRMadagascarMalawiMalaysiaMaliMauritaniaMexicoMiddle East & North AfricaMiddle East & North Africa (excluding high income)Middle East & North Africa (IDA & IBRD countries)Middle incomeMoldovaMongoliaMoroccoMozambiqueMyanmarNamibiaNepalNetherlandsNew ZealandNicaraguaNigerNigeriaNorth AmericaNorwayOECD membersOmanPakistanPanamaPapua New GuineaParaguayPeruPhilippinesPolandPortugalPost-demographic dividendPre-demographic dividendPuerto RicoQatarRomaniaRussian FederationRwandaSaudi ArabiaSenegalSerbiaSierra LeoneSingaporeSlovak RepublicSomaliaSouth AfricaSouth AsiaSouth Asia (IDA & IBRD)South SudanSpainSri LankaSub-Saharan Africa Sub-Saharan Africa (excluding high income)Sub-Saharan Africa (IDA & IBRD countries)SudanSwedenSwitzerlandSyrian Arab RepublicTajikistanTanzaniaThailandTogoTunisiaTurkeyTurkmenistanUgandaUkraineUnited Arab EmiratesUnited KingdomUnited StatesUpper middle incomeUruguayUzbekistanVenezuela, RBVietnamWest Bank and GazaWorldYemen, Rep.ZambiaZimbabwe Timeline:
This timeline shows a graph from 1961 to 2016 of Malaysia. No data until 1960. Number of actual observations by date: 56.
Source name:
World Development Indicators
Source organization:
United Nations, World Urbanization Prospects.
Categories, topics:
Urban Development
Last updated:
apr 23, 2017
Indicators value changes by year
Minimum:
12.364
jan 1, 1971
Maximum:
30.173
jan 1, 2016
At the date of observation
Value
Absolute change
Change from previous value
jan 1, 1961
15.826
+15.826
0.0%
jan 1, 1962
15.373
-0.453
-2.86%
jan 1, 1963
14.93
-0.444
-2.89%
jan 1, 1964
14.506
-0.424
-2.84%
jan 1, 1965
14.112
-0.394
-2.72%
jan 1, 1966
13.753
-0.359
-2.54%
jan 1, 1967
13.429
-0.324
-2.35%
jan 1, 1968
13.134
-0.295
-2.19%
jan 1, 1969
12.863
-0.271
-2.06%
jan 1, 1970
12.608
-0.255
-1.99%
jan 1, 1971
12.364
-0.244
-1.94%
jan 1, 1972
12.676
+0.313
2.53%
jan 1, 1973
13.043
+0.367
2.89%
jan 1, 1974
13.426
+0.383
2.94%
jan 1, 1975
13.831
+0.405
3.02%
jan 1, 1976
14.259
+0.428
3.09%
jan 1, 1977
14.711
+0.452
3.17%
jan 1, 1978
15.183
+0.472
3.21%
jan 1, 1979
15.675
+0.492
3.24%
jan 1, 1980
16.181
+0.506
3.23%
jan 1, 1981
16.702
+0.521
3.22%
jan 1, 1982
17.283
+0.581
3.48%
jan 1, 1983
17.879
+0.596
3.45%
jan 1, 1984
18.487
+0.608
3.4%
jan 1, 1985
19.106
+0.619
3.35%
jan 1, 1986
19.73
+0.624
3.27%
jan 1, 1987
20.363
+0.633
3.21%
jan 1, 1988
21.008
+0.645
3.17%
jan 1, 1989
21.677
+0.669
3.18%
jan 1, 1990
22.379
+0.703
3.24%
jan 1, 1991
23.132
+0.753
3.36%
jan 1, 1992
23.942
+0.809
3.5%
jan 1, 1993
24.395
+0.453
1.89%
jan 1, 1994
24.826
+0.432
1.77%
jan 1, 1995
25.289
+0.462
1.86%
jan 1, 1996
25.776
+0.487
1.93%
jan 1, 1997
26.288
+0.512
1.99%
jan 1, 1998
26.827
+0.539
2.05%
jan 1, 1999
27.411
+0.584
2.18%
jan 1, 2000
28.055
+0.644
2.35%
jan 1, 2001
28.773
+0.717
2.56%
jan 1, 2002
28.688
-0.085
-0.29%
jan 1, 2003
28.64
-0.048
-0.17%
jan 1, 2004
28.629
-0.01
-0.04%
jan 1, 2005
28.646
+0.017
0.06%
jan 1, 2006
28.68
+0.034
0.12%
jan 1, 2007
28.731
+0.051
0.18%
jan 1, 2008
28.8
+0.07
0.24%
jan 1, 2009
28.891
+0.09
0.31%
jan 1, 2010
29.001
+0.111
0.38%
jan 1, 2011
29.137
+0.136
0.47%
jan 1, 2012
29.296
+0.159
0.55%
jan 1, 2013
29.485
+0.189
0.64%
jan 1, 2014
29.704
+0.219
0.74%
jan 1, 2015
29.955
+0.251
0.84%
jan 1, 2016
30.173
+0.218
0.73%
Ranking of countries by current statistics by years


Comments: